Beschreibung
🚀Preisprojektion Swing-Volumen: 📈
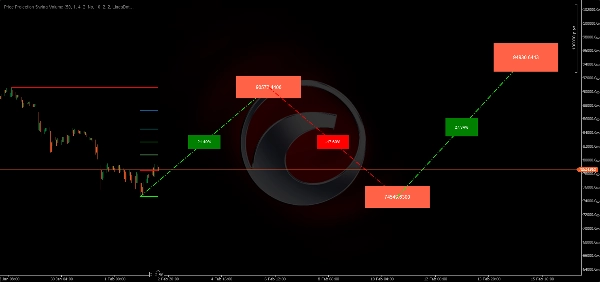
https://chartshots.spotware.com/c/6980f0f0287fb
Die Preisprojektion Swing-Volumen ist ein fortschrittliches Prognosewerkzeug, das entwickelt wurde, um den wahrscheinlichsten zukünftigen Pfad eines Vermögenswerts basierend auf jüngsten Preisschwankungen und Fibonacci-Harmonischen Verhältnissen abzubilden. Es identifiziert die aktuelle Marktspanne und projiziert eine mehrstufige "Roadmap" für potenzielle Kursbewegungen.
🔍 Marktanalyse & Bedingungen
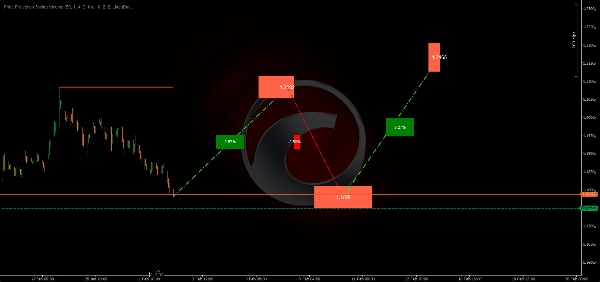
https://chartshots.spotware.com/c/6980f104dab21
Dieser Algorithmus konzentriert sich auf die Identifizierung der "Marktumhüllung" durch Analyse von:
- Extremen Schwungpunkten: Er durchsucht einen bestimmten Lookback-Zeitraum (z. B. die letzten 50 Balken), um das absolute Höchsthoch und Tiefsttief zu finden.
- Retracement-Zonen: Er berechnet und zeichnet automatisch fünf wichtige Fibonacci-Niveaus (23,6 %, 38,2 %, 50 %, 61,8 % und 78,6 %) innerhalb des aktuellen Schwungs, um Interessensbereiche zu identifizieren.
- Harmonische Projektionen: Mithilfe des Projektion-Verhältnisses (Standard 0.618) berechnet der Algorithmus einen dreiteiligen zukünftigen Pfad basierend auf gemessenen Bewegungen vom letzten Schwungpunkt.
🟢 Wie man Signale & Visualisierungen interpretiert
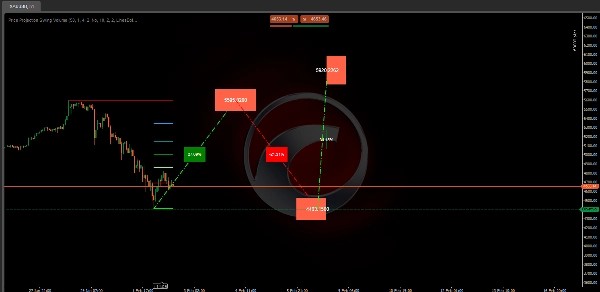
https://chartshots.spotware.com/c/6980f126d875a
- Horizontale Schwunglinien: Die dicken roten (hoch) und grünen (tief) Linien stellen die aktuellen Marktgrenzen dar. Ein Durchbruch dieser Linien signalisiert oft eine Trendwende.
- Der Projektionspfad (gestrichelte Linien): Die diagonalen Linien prognostizieren eine "Zickzack"-Bewegung. Dies ist die Vorhersage des Algorithmus, wie sich der Preis bewegen könnte, um sein endgültiges Ziel zu erreichen.
- Prozentuale Beschriftungen: An den diagonalen Linien zeigen diese das erwartete % Gewinn oder Verlust für diesen spezifischen Abschnitt der Bewegung an.
- Zielpreisfelder: Die farbigen Felder am Ende jedes Abschnitts geben das exakte Kursniveau an, das der Algorithmus anstrebt.
⚙️ Wichtige Einstellungen & Parameter
- Lookback-Zeitraum (50): Bestimmt den Umfang der Schwünge. Eine höhere Zahl sucht nach "Makro"-Schwüngen, während eine niedrigere Zahl sich auf "Mikro"-Scalping-Schwünge konzentriert.
- Projektionsverhältnis (0,618): Dieses "Goldene Verhältnis" bestimmt die Tiefe und Höhe der projizierten Zickzack-Bewegungen. Sie können dies für aggressivere oder konservativere Ziele anpassen.
- Visuelle Anpassung: Vollständig anpassbare Farben für bullische/bärische Projektionen und spezifische Fibonacci-Niveaus, um Ihr Chart-Thema anzupassen.
🚀 Typische Anwendungsfälle & Szenarien
- Zielsetzung: Verwenden Sie die projizierten Preisfelder, um Take-Profit-Niveaus für Swing-Trades festzulegen.
- Antizipation von Umkehrungen: Wenn die Projektion eine tiefe Korrektur vor einer Aufwärtsbewegung zeigt, können Trader warten, bis der Preis die "Tal"-gestrichelte Linie erreicht, bevor sie einsteigen.
- Gemessene Bewegungen: Hervorragend für Trader, die "ABCD"-Muster oder harmonische Kursbewegungen verfolgen.
👤 Ziel-Trader-Profil
- Swing- & Trend-Trader: Ideal für diejenigen, die Positionen über mehrere Tage halten und eine Roadmap potenzieller Widerstände benötigen.
- Harmonische Trader: Perfekt für Nutzer, die auf Fibonacci-Verhältnisse angewiesen sind, aber die Berechnungen automatisch erledigt haben möchten.
- Erfahrungsniveau: Mittelstufe. Trader sollten verstehen, dass dies Projektionen sind und zusammen mit anderen Bestätigungen verwendet werden sollten.
⚠️ Wichtige Einschränkungen & Nutzungshinweise
- Dynamische Aktualisierung: Die Projektionen und Schwungniveaus "verschieben" sich in Echtzeit, wenn innerhalb des Lookback-Fensters ein neues Hoch oder Tief entsteht.
- Initialisierung: Der Indikator benötigt eine Mindestmenge an Historie (entsprechend dem Lookback-Zeitraum), bevor er genau zu zeichnen beginnen kann.
Zusammenfassung
The indicator visually displays horizontal swing boundary lines (red for highs, green for lows), dotted diagonal projection lines with percentage gain or loss labels, and target price boxes indicating exact projected price levels. These features help traders set take profit targets, anticipate retracements or reversals, and identify measured moves consistent with harmonic patterns.
Key customizable settings include the lookback period for swing scale, projection ratio for target aggressiveness, and visual color options for bullish/bearish projections and Fibonacci levels. The indicator updates dynamically as new highs or lows form within the lookback window and requires sufficient historical data to initialize.
Price Projection Swing Volume supports multiple markets including BTCUSD, EURUSD, GBPUSD, NZDUSD, XAUUSD, NAS100, and USDJPY, making it suitable for traders using Fibonacci-based harmonic strategies and swing trading approaches.