Bar Force
Indicator
Version 1.0, Mar 2026
Windows, Mac
"Bar Force" uploaded image"Bar Force" uploaded image"Bar Force" uploaded image"Bar Force" uploaded image"Bar Force" uploaded image"Bar Force" uploaded image
593.86K
Traded volume
25.15K
Pips won
3
Sales
13
Free installs
About trial version
The indicator analyzes a set of previous bars and calculates the relative strength of the current candle, displaying a numerical classification directly on the chart. This helps traders quickly identify moments of momentum, acceleration, or volatility expansion. The Trial version allows traders to experience the core logic of the indicator before upgrading to the full version. Key Features ✔ Automatic bar strength classification ✔ Based on recent market volatility analysis ✔ Direct chart display for fast reading ✔ Ideal for Price Action and Momentum strategies Trial Version Limitations This trial version includes some limitations compared to the full version: Displays classifications only on the most recent bars Reduced customization options Advanced features available only in the Full version

Bar Force is a bar strength analysis indicator designed to help traders quickly identify moments of volatility expansion and market momentum.

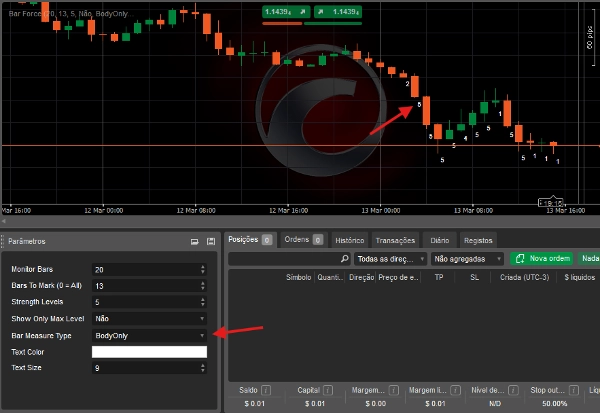
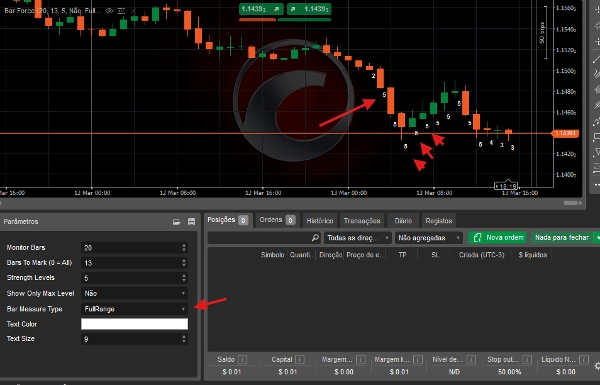
The indicator automatically classifies each bar based on its relative strength compared to previous bars, displaying a numerical value directly on the chart. This makes it easy to spot weak, average, or extremely strong candles within the recent market context.

The Full Version provides complete control over the analysis parameters, allowing traders to adapt the indicator to different markets, timeframes, and trading styles.

Key Features

✔ Automatic bar strength classification
✔ Based on recent market volatility
✔ Direct chart display for quick visual analysis
✔ Ideal for Price Action, Breakout, and Momentum trading

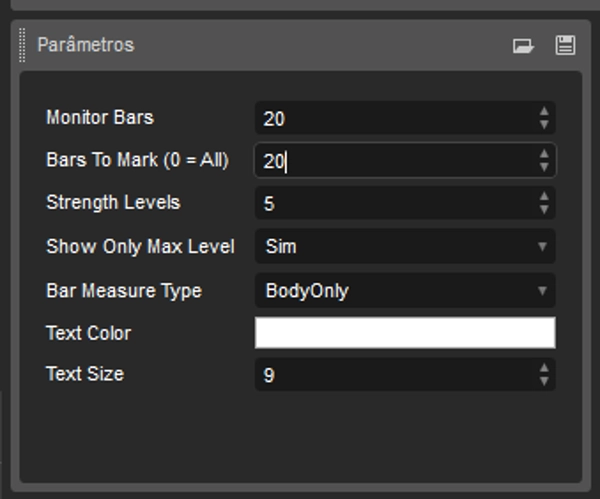
Configurable Parameters

The full version offers complete customization.

Bar measurement type

Users can choose how the strength of each bar is calculated:

  • Full Range – uses the total range of the candle (High – Low)
  • Body Only – uses only the candle body (Open – Close)

This allows the indicator to be used for both volatility analysis and directional strength analysis.

Monitoring range

Defines how many previous bars are used to calculate the average market strength.

Examples:

  • 50 bars
  • 100 bars
  • 200 bars

This allows the indicator to adapt to different market conditions.

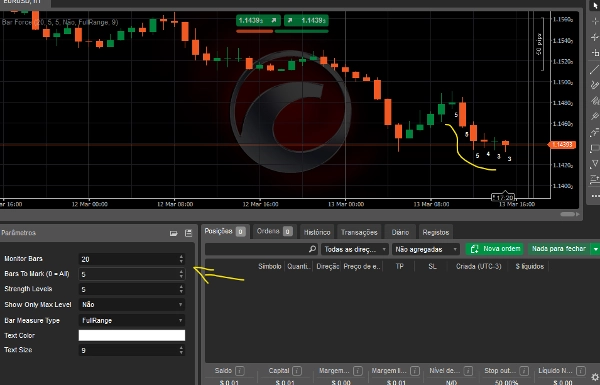
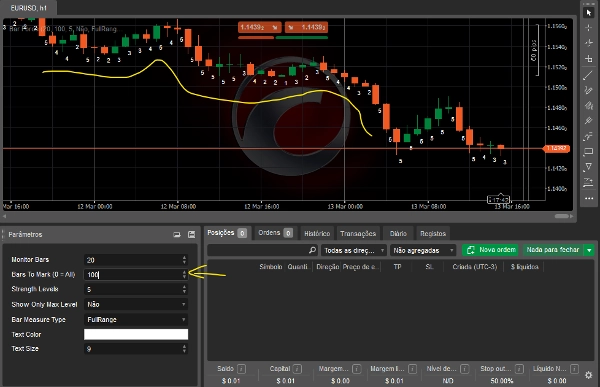
Number of bars displayed

Traders can choose how many recent bars will display the strength classification on the chart.

Examples:

  • last 5 bars
  • last 20 bars
  • or the entire history

Strength scale

Defines how many levels of classification are used.

Examples:

  • scale from 1 to 3
  • scale from 1 to 5
  • or a custom range

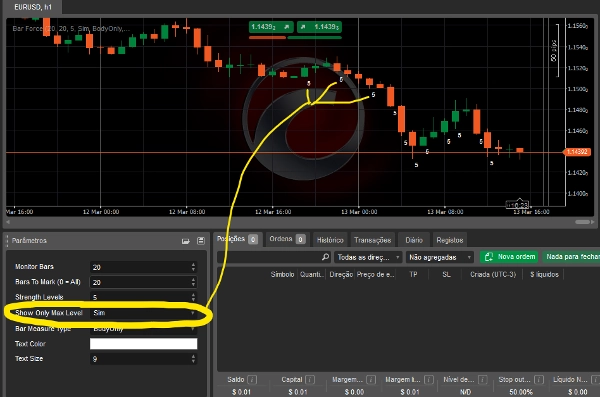
Maximum level filter

Option to display only bars that reach the maximum strength level, making it easier to identify strong momentum events.

Visual customization

Users can also adjust:

  • text color
  • text size

allowing the indicator to match their chart layout.

Who is this indicator for?

  • Price Action traders
  • Breakout traders
  • Traders looking to identify momentum and volatility expansion

Bar Force transforms visual candle analysis into an objective strength classification, helping traders quickly identify potential opportunities in the market.

0.0
Reviews: 0
Customer reviews
No reviews for this product yet. Already tried it? Be the first to tell others!
NAS100
NZDUSD
Breakout
XAUUSD
Commodities
Forex
EURUSD
GBPUSD
BTCUSD
Indices
Prop
Stocks
Crypto
USDJPY
Scalping

More from this author

Indicator
NAS100
NZDUSD
XAUUSD
+10
Price Action indicator that automates key opens and levels, keeping the focus on clear price behavior.
cBot
RSI
Breakout
Supertrend
+4
H1 and L1 BOT — Pure Price Action Automation - NEW VERSION IN PROGRESS...
1.52
Profit factor
0.5%
Max drawdown

You may also like

Indicator
Grid
NAS100
NZDUSD
+15
The FZ indicator draws Fibonacci channel zones based on the highest and lowest prices over a user-defined period.
Indicator
Indices
FVG
Commodities
+6
The only cTrader FVG indicator with Breakaway Gap detection, mitigation tracking, and full multi-asset compatibility.
Indicator
NAS100
RSI
NZDUSD
+17
Institutional liquidity map for XAUUSD. Spot stop hunts, find the next target, and get a full trade setup automatically.
Indicator
Indices
Prop
FVG
+6
SMC indicator for cTrader detecting order blocks, fair value gaps, liquidity sweeps and market structure with buy/sell
Indicator
Grid
NAS100
NZDUSD
+13
PhantomGrid draws clear grid levels to help spot entries, exits, and key price zones with ease.
Indicator
Indices
Prop
Stocks
+3
Visualize the four major trading sessions with color-coded rectangles showing session high/low ranges.
Indicator
NAS100
RSI
NZDUSD
+14
Scalping & Swing signals in one. Smart S/R, Auto SL/TP, HTF panel. No repainting. Built for serious traders.
Indicator
NAS100
NZDUSD
XAUUSD
+10
Sero is a stochastic-based momentum oscillator that gives clear, color-coded visual signals for market momentum shifts.
Indicator
NAS100
Breakout
XAUUSD
+6
GUPPY TREND MASTER V3.. Visualize Market Sentiment with the 38-EMA Rainbow The Guppy Trend Master 4X4 Indicator
Indicator
Grid
NAS100
NZDUSD
+19
Session Volume Profile
Indicator
NAS100
RSI
NZDUSD
+13
🚀 HAI QUANTUM v4.0 | The Ultimate Quantum Terminal for cTrader (Smart Money & Algorithmic Trading)
593.86K
Traded volume
25.15K
Pips won
3
Sales
13
Free installs