
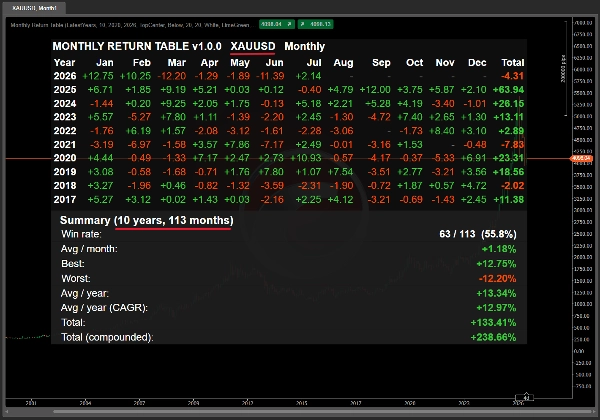
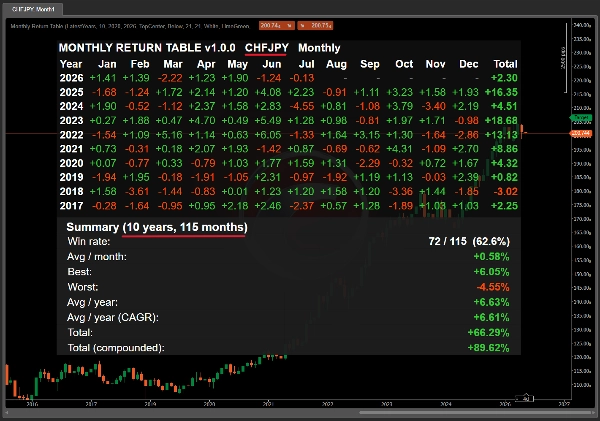
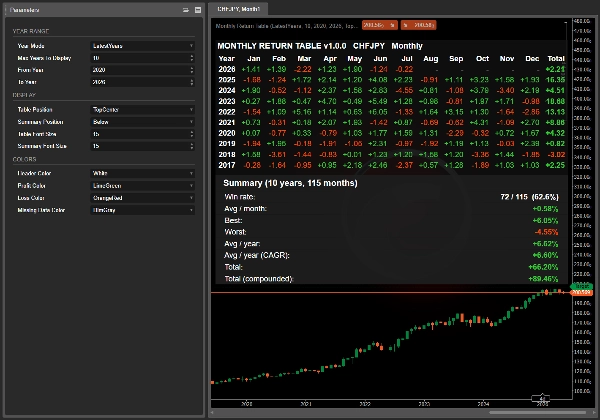

Description
See any asset's historical performance in one glance — no backtest required.
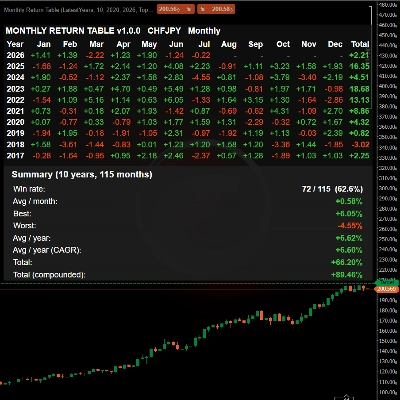
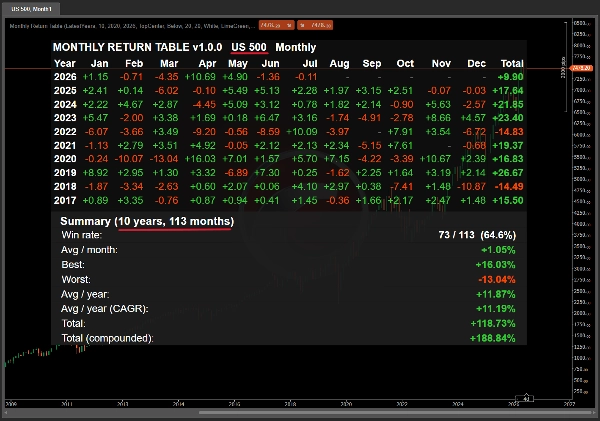
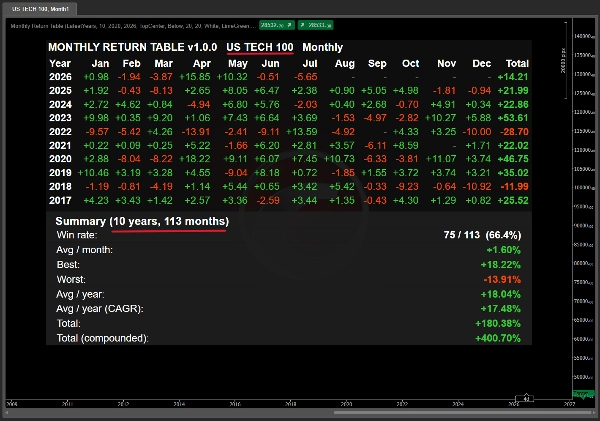
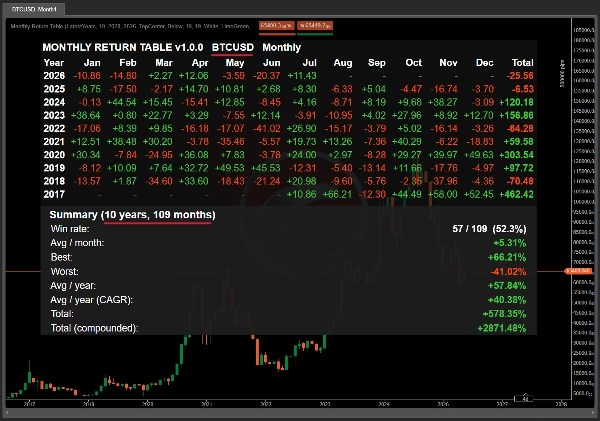
Drop it on any chart. Instantly see monthly returns for the last 10+ years, color-coded by profit and loss, with a full statistical summary. Works on any symbol, any timeframe — Forex, Metals, Indices, Crypto. The fastest way to answer: "Is this asset actually worth trading?"
WHAT IT DOES
Monthly Return Table calculates the monthly percentage return of any asset — open of the first bar of the month to close of the last bar — and displays it as a clean, color-coded matrix directly on your chart.
No backtest. No optimization. No waiting.
Attach it, and the entire performance history appears in under a second.
WHY IT EXISTS
Before you invest capital, deploy a bot, or design a strategy, you should know one thing: how has this asset actually behaved?
Most traders skip this step. They open a chart, see recent price action, and make decisions based on the last few months. Monthly Return Table forces you to look at the full picture — every month, every year, side by side.
You'll immediately see:
• Which months tend to be strong or weak (seasonality)
• Whether the asset trends or ranges over time
• The realistic drawdown you should expect
• The compounded return of simply holding through each month
KEY FEATURES
• Full monthly matrix — 12 months × up to 30 years, all on one screen
• Color-coded cells: green profit, red loss
• Complete statistical summary: Win rate, Avg/month, Best, Worst, Avg/year, CAGR, Total (simple + compounded)
• Year Mode: Latest N years OR specific range (e.g. 2020-2022)
• 9 chart positions, adjustable font sizes, custom colors
• Timezone-aware month detection — works correctly with every broker
• Zero configuration required
• No repainting, no lag, no external data
WHO THIS IS FOR
• Retail traders who want to stop guessing and decide based on real historical data
• Bot users and buyers who want to evaluate a symbol before committing capital
• Portfolio builders comparing candidates for consistent, compoundable returns
• Content creators needing clean, professional performance visualizations
WHAT IT IS NOT
This is not a trading signal. It doesn't tell you when to buy or sell. It doesn't predict the future.
What it does is answer a simple, foundational question every trader should ask before touching an asset: "Show me the numbers."
Stop guessing. Start seeing.
Built by Black Rock — Forex & Gold trading specialists. Full support via cTrader messaging. Updates included.
Summary
Key features include a full monthly matrix (12 months by up to 30 years), color-coded cells indicating profit (green) and loss (red), and a comprehensive statistical summary covering metrics such as win rate, average monthly return, best and worst months, average yearly return, CAGR, and total returns (simple and compounded). Users can customize the display with adjustable font sizes, colors, and chart positions. The indicator is timezone-aware to ensure accurate month detection across brokers and requires no configuration.
Monthly Return Table is designed to help traders, bot users, portfolio builders, and content creators quickly assess an asset’s historical performance, seasonality, trend behavior, and realistic drawdowns. It does not provide trading signals or predictions but offers a clear, data-driven view of past performance to inform trading decisions.
Discussion
Customer reviews
FAQ















Price