present
Registe-se e receba 50 $ de desconto na sua primeira compra
Trading product for Wstęgi DoubleSMMA Indicador, image 1
Wstęgi DoubleSMMA
Desde 16/05/2025
165
Instalações gratuitas

Descrição

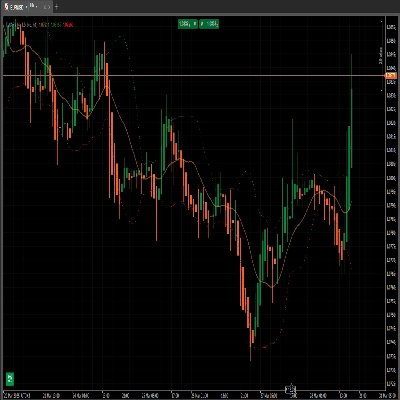
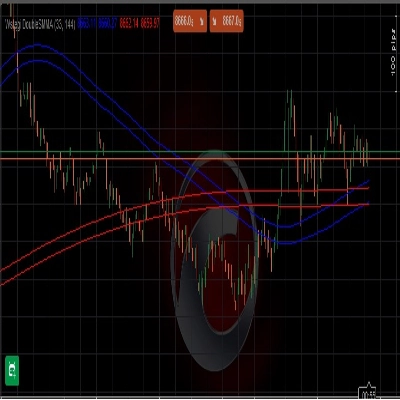
Fitas HTS SMMA 33 144

Resumo

Resumo de IA
Wstęgi DoubleSMMA is a trading indicator featuring HTS SMMA bands with periods of 33 and 144. It is designed to be applied on price charts to assist traders in analyzing market trends and potential support or resistance levels. The indicator uses Smoothed Moving Averages (SMMA) to generate bands that reflect price volatility and trend direction over two different timeframes. This dual-period approach aims to provide a clearer view of market dynamics by combining short- and long-term smoothing. The product is suitable for integration into various trading platforms that support custom indicators.
Perfil do indicador

Conversa

Avaliações de clientes

0.0
Avaliações: 0
Avaliações de clientes
Ainda não há avaliações para este produto. Já o experimentou? Seja o primeiro a contar a outras pessoas!

Perguntas frequentes

Os produtos disponíveis através da cTrader Store, incluindo bots de negociação, indicadores e plugins, são fornecidos por programadores terceiros e são disponibilizados apenas para fins informativos e de acesso técnico. A cTrader Store não é um corretor e não fornece aconselhamento em matéria de investimento, recomendações pessoais ou qualquer garantia de desempenho no futuro.

Mais deste autor
Wstęgi HTS 33 144 mobile

Também poderá gostar de

PRO Liquidity Sweep + FVG Combo detector with custom Gold/Blue signals & alerts
Simple ICT Concepts
Smart fractals + auto Fibonacci + dynamic S/R zones with HTF confluence & Bull/Bear bias panel. Institutional-grade.
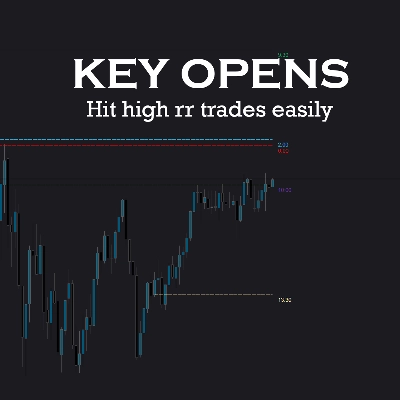
Key NY session opens for NASDAQ (US100) & SP500 to find Tick Precise Entrys for High R:R intraday setups.
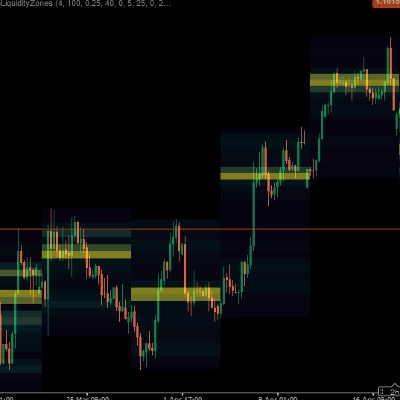
Heatmap Liquidity Zones Visualize volume-at-price, uncover hidden support/resistance, and track market liquidity in real
A powerful cTrader indicator with customizable Moving Average alerts, notifications, and automated trading actions.
🚀 MACD Pro Trader – Advanced MACD with buy/sell signals, custom MAs & color-coded histograms for smarter trading! 📈🔥
Renko Multi-Level Grid Overlay draws configurable horizontal grid lines on any chart type, for multi-timeframe analysis.
Angora Pattern Recognition is a cTrader indicator that finds, draws and tracks classic chart patterns automatically.
Pinpoint FVGs, track fills and see mitigation stats — trade imbalances with clarity and confidence.
Helps traders execute orders strategically by calculating the average price over a set time period
CRT Sweep Tracker is an advanced panel for Candle Range Theory (CRT) traders to track HTF sweeps and manage live trades.
Free Volume Profile v2.0
Boost trading with Divergency ! Spot divergences & trends with 12 oscillators. Enjoy for Free... and with CS !🚀
The Parabolic SAR, or "Stop and Reverse," is a dynamic technical analysis tool.
Map market structure, order blocks, liquidity and key zones with an interactive cTrader dashboard.
Angora Pattern Recognition is a cTrader indicator that finds, draws and tracks classic chart patterns automatically.
🎯Automatically identifies the market's significant turning points (key H & L) and draws dynamic support and.....✍️

Preço

Desde 16/05/2025
165
Instalações gratuitas