Descripción
Un indicador que se convierte en un sistema de trading
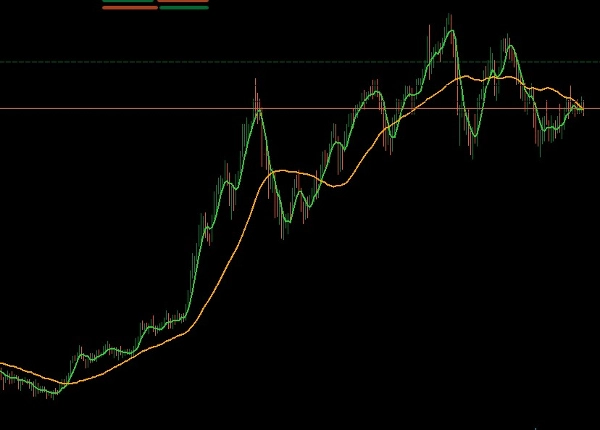
Este indicador, cuando se usa en un gráfico semanal, puede convertirse en un sistema de trading completo. Su principal fortaleza es que filtra el ruido del mercado típico de marcos temporales más cortos, mostrándote solo la dirección clave a largo plazo.
Una estrategia de trading basada en tendencias
La condición principal para el éxito es la capacidad del trader para identificar el final de un movimiento lateral (consolidación). Cuando un instrumento finalmente rompe este período de incertidumbre y el indicador señala con confianza una nueva dirección, ese es el momento perfecto para entrar al mercado.
Dado que la operación se realiza en un gráfico semanal, está enfocada en capturar una tendencia principal. Como resultado, un trader paciente que entra con precisión al mercado al inicio de una tendencia puede lograr una muy buena ganancia con una sola operación. Este indicador se transforma de una herramienta simple en la base de una estrategia de trading sencilla pero poderosa para quienes están dispuestos a esperar y operar las tendencias principales.
Resumen
Valoraciones de clientes
5 | 0 % | |
4 | 100 % | |
3 | 0 % | |
2 | 0 % | |
1 | 0 % |