
WAVETREND_withSourceCode
Indicador
Versão 1.0, Oct 2025
Windows, Mac
5.0
Avaliações: 2
Descrição
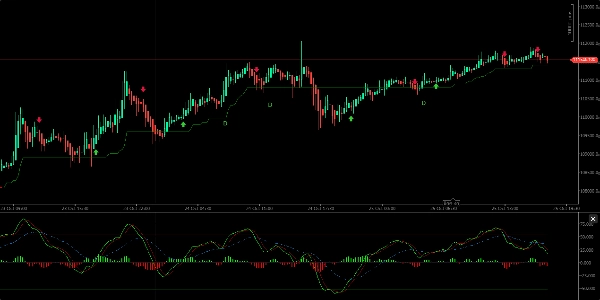
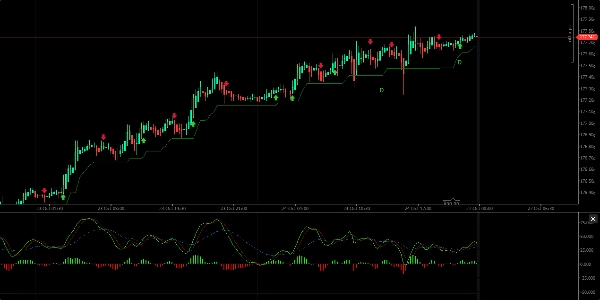
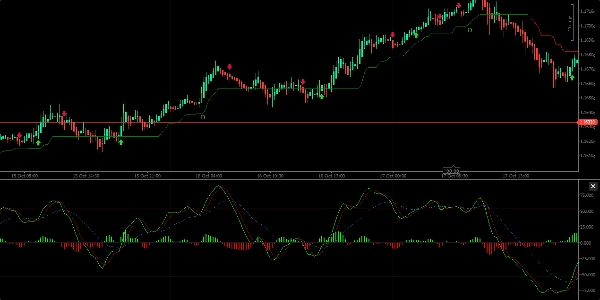
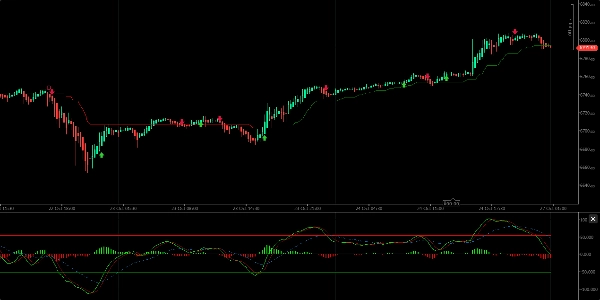
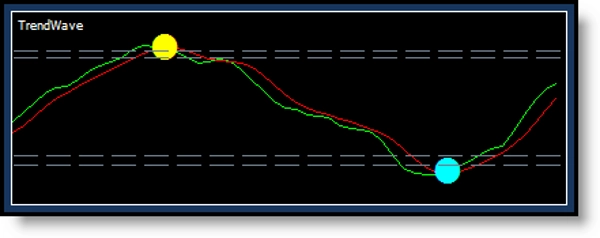
Ele fornece sinais de compra e venda, indicação da direção da tendência e identifica zonas de sobrecompra e sobrevenda. Visualmente, é composto por duas linhas de valor com uma nuvem/histograma no centro, que se move acima e abaixo de uma linha média, representando tendências de alta ou baixa.
Principais Características:
- Sinais de compra ocorrem quando a linha verde cruza a linha vermelha para cima; sinais de venda quando a linha verde cruza para baixo.
- Mostra a direção da tendência com ondas de nuvem acima ou abaixo da linha média.
- O indicador exibe pontos verdes (compra) e vermelhos (venda) nos pontos de cruzamento, com mudanças correspondentes na cor das velas (amarelo para compra, turquesa para venda).
- Melhor usado em intervalos de 12 horas ou 1 dia para evitar ruído excessivo de curto prazo.
- O indicador pode identificar divergências entre preço e momentum (divergência regular de alta e baixa), sinalizando potenciais reversões de preço.
- É aconselhável combinar o WaveTrend com outros indicadores como WMA, CMF, RSI e MACD para decisões de negociação mais confiáveis.
No geral, o WaveTrend é uma ferramenta funcional útil para identificar a direção da tendência e sinais de negociação, mas deve ser usado junto com outras ferramentas de análise para confirmação.
Resumo
Perfil do indicador
Avaliações de clientes
5.0
Avaliações: 2
5 | 100 % | |
4 | 0 % | |
3 | 0 % | |
2 | 0 % | |
1 | 0 % |
Avaliações de clientes
November 6, 2025
the main upside is the trade idea gets slowed down first. The setup still needs say no.
Conversa
Perguntas frequentes
Signal
ZigZag
EURUSD
Supertrend
GBPUSD
RSI
XAUUSD
NAS100
ATR
MACD
Os produtos disponíveis através da cTrader Store, incluindo bots de negociação, indicadores e plugins, são fornecidos por programadores terceiros e são disponibilizados apenas para fins informativos e de acesso técnico. A cTrader Store não é um corretor e não fornece aconselhamento em matéria de investimento, recomendações pessoais ou qualquer garantia de desempenho no futuro.


Preço
Desde 16/03/2025
256
Instalações gratuitas