Deskripsi
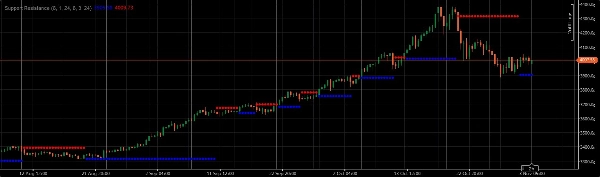
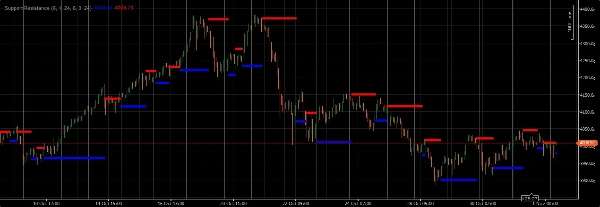
Saat berdagang emas, gunakan level support dan resistance di berbagai kerangka waktu (grafik besar, rentang, dan tick) untuk mengidentifikasi potensi breakout pivot atau titik support/resistance. Selalu konfirmasi sinyal ini dengan indikator teknis lain seperti moving averages, osilator, dan pola candlestick untuk perdagangan dengan probabilitas lebih tinggi
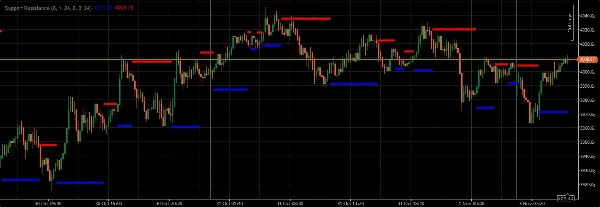
Saat berdagang emas, gunakan level support dan resistance di berbagai kerangka waktu (grafik besar, rentang, dan tick) untuk mengidentifikasi potensi breakout pivot atau titik support/resistance. Saat berdagang emas, gunakan level support dan resistance di berbagai kerangka waktu (grafik besar, rentang, dan tick) untuk mengidentifikasi potensi breakout pivot atau titik support/resistance. Level-level ini, setelah diidentifikasi, dapat berfungsi sebagai titik keputusan yang penting. Breakout di atas resistance atau di bawah support, terutama ketika disertai dengan peningkatan body candle, sering menandakan kelanjutan tren atau perubahan signifikan dalam sentimen pasar. Sebaliknya, pantulan dari level support atau penolakan di resistance dapat menunjukkan potensi pembalikan atau kelanjutan konsolidasi saat ini. Selalu konfirmasi sinyal ini dengan indikator teknis lain seperti moving averages, osilator, dan pola candlestick untuk perdagangan dengan probabilitas lebih tinggi. Selain itu, perhatikan dengan cermat peristiwa berita dan rilis data ekonomi, karena hal ini dapat secara dramatis mempengaruhi harga emas dan membatalkan setup teknis murni. Manajemen risiko sangat penting; jangan pernah mempertaruhkan lebih dari persentase kecil dari modal perdagangan Anda pada satu perdagangan tunggal.
Ringkasan
Ulasan pelanggan
5 | 100 % | |
4 | 0 % | |
3 | 0 % | |
2 | 0 % | |
1 | 0 % |


