
Dynamic Trend Flux
Indicador
Versão 1.0, Nov 2025
Windows, Mac
4.0
Avaliações: 1
Descrição
Dynamic Trend Flux
Tipo: Oscilador de momentum / tendência (estilo MACD, multicolorido)
O que faz
Dynamic Trend Flux é um oscilador de momentum colorido baseado na clássica diferença EMA rápida/lenta mais uma linha de sinal.
Ele ajuda você a ver de relance:
- quando o momentum está em alta ou baixa,
- se o momentum está fortalecendo ou enfraquecendo,
- e onde ocorrem mudanças de tendência (cruzamentos da linha principal com a linha de sinal).
O indicador desenha:
- Linha principal (linha Flux)
-
- construída a partir da diferença entre uma EMA rápida e uma lenta
- muda de cor dependendo se está acima ou abaixo da linha de sinal (opcional).
- Linha de sinal
-
- uma média móvel da linha principal, usada como um gatilho suavizado.
- Histograma com 4 cores (opcional)
-
- mostra a distância entre a linha principal e a linha de sinal,
- a cor codifica tanto a direção (acima/abaixo de zero) quanto a mudança de força de barra para barra.
- Pontos nos cruzamentos (opcional)
-
- destaca onde a linha principal cruza a linha de sinal → potenciais mudanças de fase da tendência.
Todos os cálculos são realizados no timeframe atual do gráfico.
Como ler
1. Linha zero
- Valores acima de zero → pressão de alta domina.
- Valores abaixo de zero → pressão de baixa domina.
2. Histograma colorido
Com o modo 4 cores LIGADO:
- Água → acima de zero e subindo
-
- momentum de alta forte / crescente.
- Azul → acima de zero mas caindo
-
- tendência de alta ainda ativa, mas momentum esfriando.
- Vermelho → abaixo de zero e caindo
-
- momentum de baixa forte / crescente.
- Bordô → abaixo de zero mas subindo
-
- fase de baixa ainda ativa, mas momentum perdendo força.
Isso torna divergências e mudanças de momentum muito mais fáceis de identificar visualmente.
3. Linhas Principal e de Sinal
- Linha principal acima da linha de sinal → fase de alta.
- Linha principal abaixo da linha de sinal → fase de baixa.
Se a mudança de cor estiver ativada:
- Linha principal Lima = acima da linha de sinal (controle de alta)
- Linha principal Vermelha = abaixo da linha de sinal (controle de baixa)
4. Pontos de cruzamento
- Ponto verde (Cruzamento para cima) → linha principal cruza acima da linha de sinal
-
- possível início de um movimento de alta.
- Ponto vermelho (Cruzamento para baixo) → linha principal cruza abaixo da linha de sinal
-
- possível início de um movimento de baixa.
Sempre combine esses sinais com estrutura / ação do preço e contexto de timeframe superior.
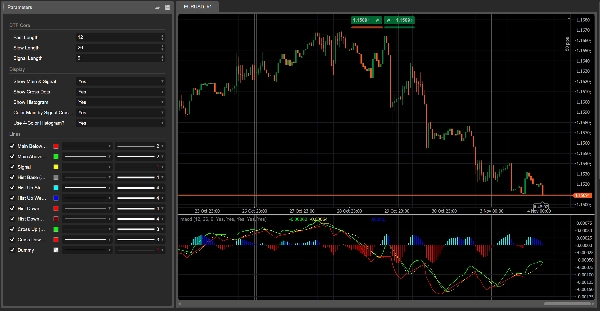
Parâmetros (Inglês)
Núcleo DTF
- Período Rápido – período da EMA rápida (padrão 12).
- Período Lento – período da EMA lenta (padrão 26).
- Período do Sinal – período da SMA de sinal aplicada à linha principal (padrão 9).
Exibição
- Mostrar Linha Principal e de Sinal – alterna as duas linhas.
- Mostrar Pontos de Cruzamento – mostra pontos nos cruzamentos principal/sinal.
- Mostrar Histograma – alterna o histograma de fundo.
- Colorir Linha Principal pelo Cruzamento com Sinal?
-
- LIGADO → linha principal Lima acima do sinal, Vermelha abaixo.
- DESLIGADO → linha principal permanece Vermelha.
- Usar Histograma 4 Cores?
-
- LIGADO → lógica aqua / azul / vermelho / bordô.
- DESLIGADO → histograma em uma única cor cinza.
Resumo
Perfil do indicador
Avaliações de clientes
4.0
Avaliações: 1
5 | 0 % | |
4 | 100 % | |
3 | 0 % | |
2 | 0 % | |
1 | 0 % |
Conversa
Perguntas frequentes
Signal
Indices
Commodities
GBPUSD
RSI
Bollinger
Fibonacci
Scalping
AI
XAUUSD
NAS100
MACD
BTCUSD
Forex
Breakout
EURUSD
NZDUSD
Martingale
Prop
ZigZag
Supertrend
Fair Value Gap
SMC
Crypto
Grid
Stocks
ATR
USDJPY
VWAP
Os produtos disponíveis através da cTrader Store, incluindo bots de negociação, indicadores e plugins, são fornecidos por programadores terceiros e são disponibilizados apenas para fins informativos e de acesso técnico. A cTrader Store não é um corretor e não fornece aconselhamento em matéria de investimento, recomendações pessoais ou qualquer garantia de desempenho no futuro.


Preço
42.11M
Volume negociado
6.13M
Pips ganhos
222
Vendas
8.38K
Instalações gratuitas