
Descrição
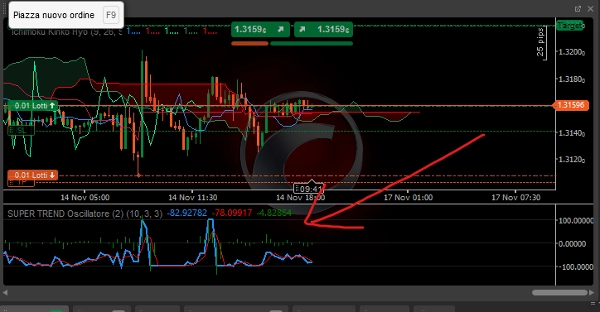
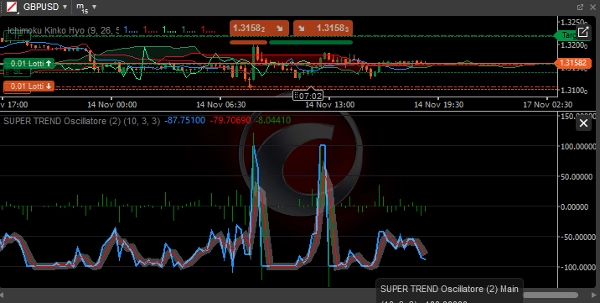
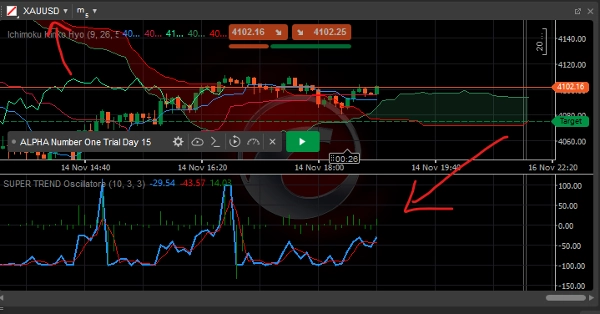
Oscilador SUPER TREND
Oscilador SuperTrend Simplificado - Descrição Completa
Visão Geral
O Oscilador SuperTrend Simplificado é um indicador técnico avançado para cTrader que transforma o SuperTrend clássico em um oscilador visual, facilitando a identificação da direção, força e confiabilidade da tendência.
Componentes Principais
1. Linha Principal (Azul)
- Função: Mostra a distância normalizada entre o preço e a linha SuperTrend
- Cálculo:
((Price - SuperTrend) / (ATR × Multiplier)) × 100 - Interpretação:
-
- > 0: Tendência de alta (preço acima do SuperTrend)
- < 0: Tendência de baixa (preço abaixo do SuperTrend)
- Intervalo: De -100 a +100
2. Linha de Sinal (Vermelha)
- Função: Média móvel simples da linha principal
- Período: Personalizável (padrão 3 períodos)
- Uso: Filtra o ruído do mercado e confirma sinais
3. Histograma (Cinza)
- Função: Diferença entre a linha principal e a linha de sinal
- Interpretação:
-
- Positivo: Momento de alta acelerando
- Negativo: Momento de baixa acelerando
- Cruzamento zero: Potenciais reversões de momento
Parâmetros Configuráveis
Parâmetros do SuperTrend:
- Período ATR: Período para cálculo do Average True Range (padrão: 10)
- Multiplicador: Multiplicador para as bandas do SuperTrend (padrão: 3.0)
Parâmetros do Oscilador:
- Período do Sinal: Período para a linha de sinal (padrão: 3)
Interpretação do Sinal
Condições de Tendência:
- Tendência Forte de Alta:
-
- Principal > +50
- Principal > Sinal
- Histograma positivo
- Tendência Forte de Baixa:
-
- Principal < -50
- Principal < Sinal
- Histograma negativo
- Mercado em Faixa:
-
- Principal entre -30 e +30
- Frequentes cruzamentos de linha
Sinais de Negociação:
Entrada Longa:
- Principal cruza acima de 0
- Histograma torna-se positivo
- Linha de sinal confirma alta
- Principal acima de +20 para momento
Entrada Curta:
- Principal cruza abaixo de 0
- Histograma torna-se negativo
- Linha de sinal confirma baixa
- Principal abaixo de -20 para momento
Saída/Take Profit:
- Longa: Principal > +80 (sobrecomprado) ou cruzamento abaixo do Sinal
- Curta: Principal < -80 (sobrevendido) ou cruzamento acima do Sinal
Vantagens da Versão Simplificada
1. Desempenho Otimizado
- Cálculos mais eficientes
- Menor consumo de recursos
- Resposta mais rápida às mudanças de preço
2. Facilidade de Uso
- Parâmetros essenciais reduzidos
- Sinais visuais imediatos
- Interpretação fácil mesmo para traders iniciantes
3. Confiabilidade
- Menos suscetível a ruídos
- Sinais mais limpos e definidos
- Redução de sinais falsos em comparação ao SuperTrend clássico
Estratégias de Uso
Estratégia de Seguimento de Tendência:
- Entrada: Principal > 0 para longa, Principal < 0 para curta
- Filtro: Histograma com mesmo sinal que o Principal
- Saída: Reversão de sinal ou níveis extremos atingidos
Estratégia de Momento:
- Entrada: Principal > +30 (longa) ou Principal < -30 (curta)
- Confirmação: Histograma acelerando
- Saída: Desaceleração do momento (histograma diminuindo)
Estratégia de Reversão à Média:
- Entrada: Principal > +80 (curta) ou Principal < -80 (longa)
- Confirmação: Reversão do histograma
- Saída: Retorno para a zona neutra
Condições Ótimas de Mercado
Mercados em Tendência:
- Alta eficiência
- Sinais prolongados
- Menos falsos rompimentos
Mercados em Faixa:
- Reduzir tamanho do lote
- Estender o período de tempo
- Usar como filtro de momento
Melhores Práticas
Intervalos de Tempo Recomendados:
- Intraday: M15 - H1
- Swing Trading: H4 - D1
- Position Trading: W1 - MN
Gestão de Risco:
- Stop Loss: 1.5-2 × ATR
- Take Profit: 2-3 × Risco
- Tamanho da Posição: 1-2% por operação
Confirmações Adicionais:
- Alinhamento em múltiplos intervalos de tempo
- Confirmação de volume
- Níveis chave de suporte/resistência
Limitações
Considerações:
- Atraso inerente (indicador de seguimento de tendência)
- Desempenho reduzido em mercados em faixa
- Necessidade de confirmações em baixa volatilidade
Recomendações:
- Combine com análise de ação de preço
- Use como filtro, não como sistema independente
- Teste em demo antes do uso ao vivo
Este oscilador representa uma ferramenta poderosa para identificar tendências fortes e filtrar sinais falsos, mantendo a simplicidade operacional adequada tanto para traders iniciantes quanto experientes.
Resumo
Avaliações de clientes
5 | 67 % | |
4 | 33 % | |
3 | 0 % | |
2 | 0 % | |
1 | 0 % |


![Logótipo de "High-Low Divergence [Iridio Capital]"](https://cdn.ctrader.com/image/webp/443c4661-7abb-40f1-842f-4b6ec560649b_40914)


