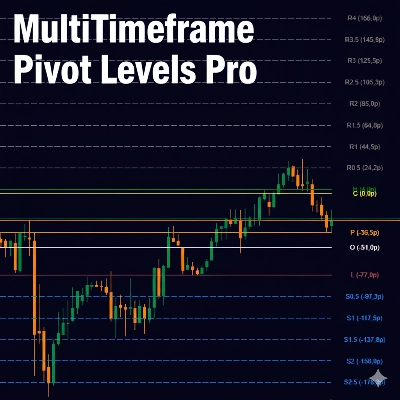
MultiTimeframe Pivot Levels Pro
Indicador
Versión 1.0, Nov 2025
Windows, Mac
Descripción
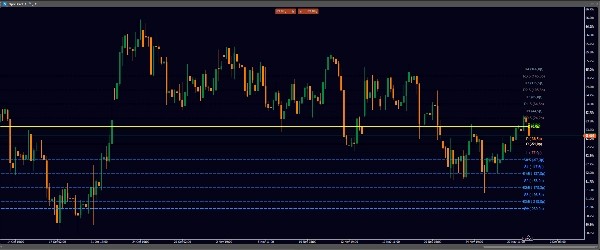
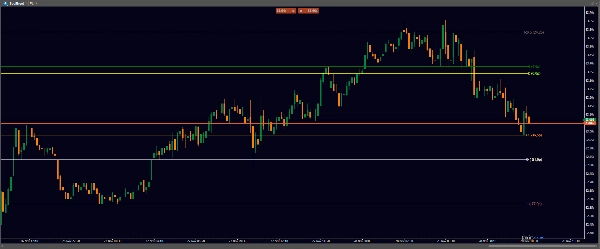
MultiTimeframe Pivot Levels Pro es un indicador de trading avanzado que muestra puntos pivote y niveles de soporte/resistencia de marcos temporales superiores directamente en tu gráfico actual. Esta poderosa herramienta ayuda a los traders a identificar niveles clave de precio para puntos estratégicos de entrada y salida.
Características clave:
- Análisis multitemporal (muestra pivotes diarios, semanales, mensuales en cualquier gráfico)
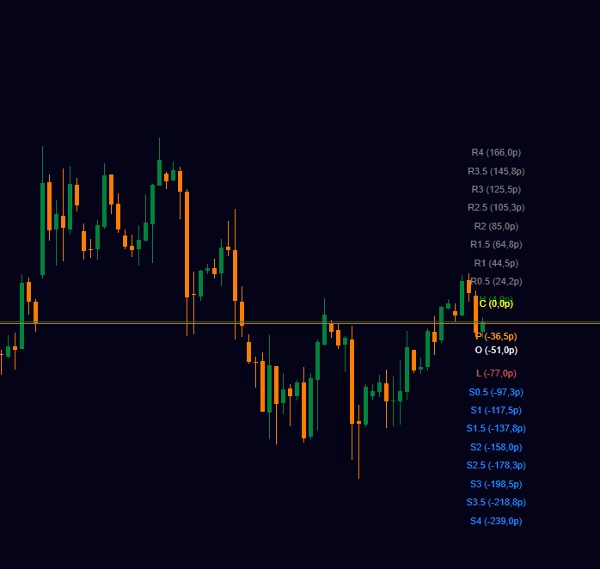
- 8 niveles de soporte y 8 niveles de resistencia para una estructura de mercado completa
- Dos métodos de cálculo de pivote (Clásico: H+L/2, Estándar: H+L+C/3)
- Colores y visibilidad personalizables para todos los niveles
- Visualización de distancia en pips desde el precio actual
- Rendimiento optimizado para una operación fluida
- Presentación visual limpia y profesional
Perfecto para:
- Traders swing que usan múltiples marcos temporales
- Traders diarios que necesitan niveles clave de referencia
- Traders de acción del precio que identifican soporte/resistencia
- Todos los estilos de trading que buscan un trading preciso basado en niveles
Resumen
Perfil del indicador
Valoraciones de clientes
0.0
Valoraciones: 0
Valoraciones de clientes
Este producto todavía no se ha valorado. ¿Ya lo ha probado? Sea el primero en informar a otros.
Conversación
Preguntas frecuentes
BTCUSD
Forex
Indices
EURUSD
Commodities
GBPUSD
NZDUSD
Crypto
Stocks
XAUUSD
NAS100
USDJPY
Los productos disponibles a través de cTrader Store, incluidos bots, indicadores y plugins para operar, son proporcionados por desarrolladores de terceros y están disponibles únicamente con fines informativos y de acceso técnico. cTrader Store no es un bróker, por lo que no proporciona asesoramiento de inversión, recomendaciones personales ni ninguna garantía de rentabilidad futura.
Más de este autor


Precio
Desde 28/12/2024
54
Instalaciones gratis