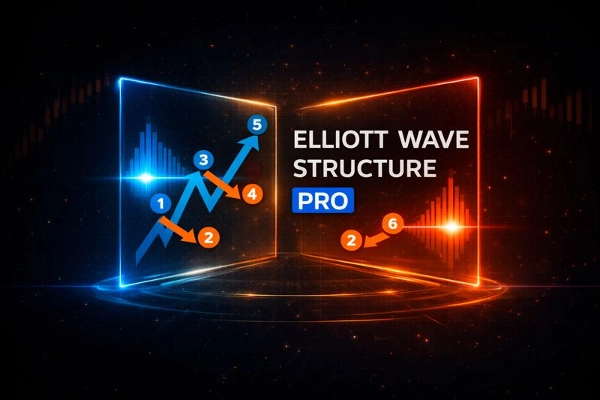
Descrição
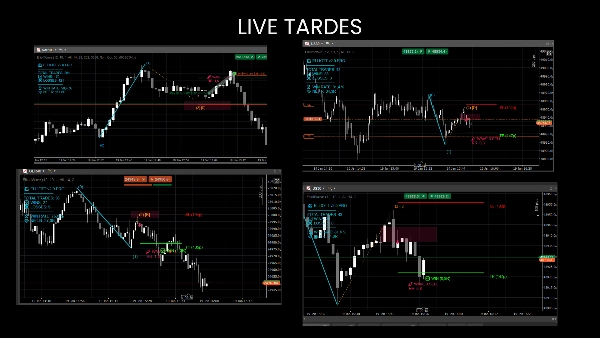
Continuação da Onda-3 de Elliott & Reversões de Elliott
Estrutura da Onda de Elliott é um indicador projetado para analisar a estrutura do mercado com a teoria das Ondas de Elliott.
Ele combina análise de swing confirmada, estrutura de mercado, detecção de impulso de Elliott, e uma continuação dedicada da Onda-2 para a Onda-3.
Esta ferramenta foi construída para traders que exigem clareza, confirmação e execução baseada em regras, não desenhos subjetivos.
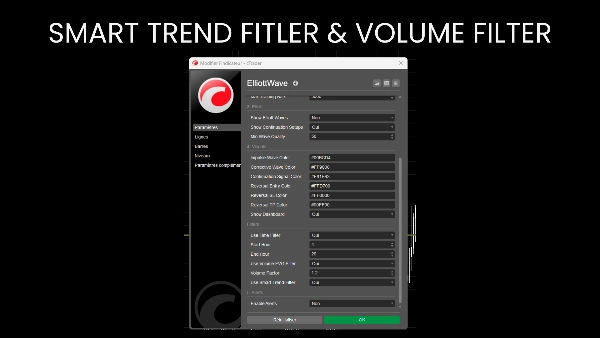
Motor de Swing que Não Re-pinta
Todos os cálculos são baseados em pontos de swing confirmados usando:
- Profundidade de swing ajustável
- Desvio mínimo de preço (filtro de pips)
- Barras de confirmação
Uma vez que um swing é impresso, ele nunca se move, garantindo total confiabilidade histórica.
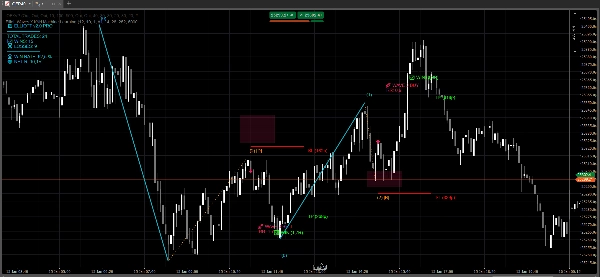
Análise da Estrutura do Mercado:
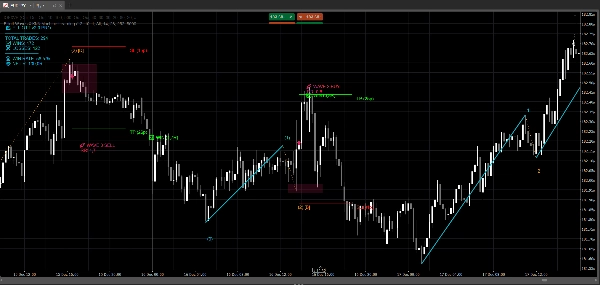
Identifica e rotula automaticamente:
- Topo Mais Alto (HH)
- Fundo Mais Alto (HL)
- Topo Mais Baixo (LH)
- Fundo Mais Baixo (LL)
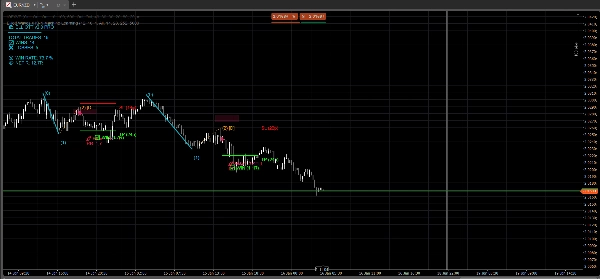
Detecção de Impulso da Onda de Elliott:
O indicador detecta automaticamente impulsos completos de 5 ondas de Elliott em ambas as direções:
- Altista: L-H-L-H-L-H
- Baixista: H-L-H-L-H-L
Valida os impulsos usando regras internas:
- Força da Onda 3
- Lógica de retração das Ondas 2 e 4
- Proporcionalidade da Onda 5
Cada impulso é classificado usando uma pontuação de qualidade (0–100) e rotulado diretamente no gráfico.
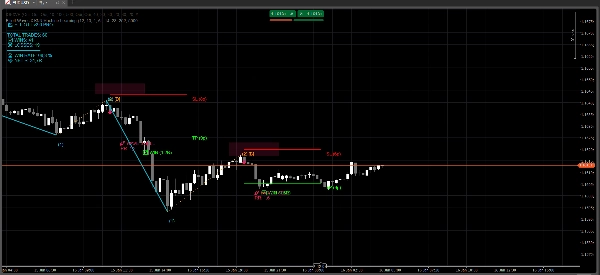
Configuração de Continuação da Onda-3 (Módulo Principal de Negociação)
Este é o componente central de negociação do indicador.
O sistema identifica estruturas de continuação da Onda 0-1-2 e prepara entradas para a Onda 3:
- Altista: Baixo → Alto → Fundo Mais Alto
- Baixista: Alto → Baixo → Topo Mais Baixo
Os critérios de validação incluem:
- Retração da Onda 2 entre 23,6% e 88,6%
- Nenhuma invalidação através da Onda 0
- Alinhamento de tendência usando estrutura de mercado
- Força da Onda 1 relativa ao ATR
- O preço deve estar sobre OB
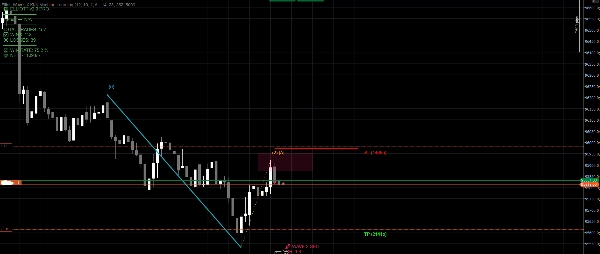
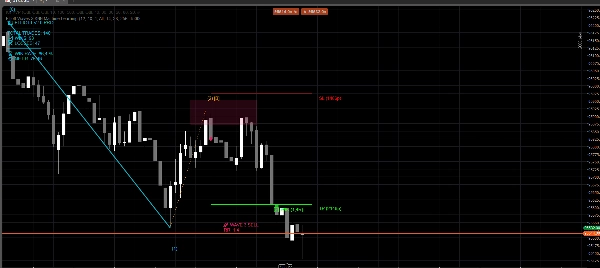
Quando validado, o indicador desenha automaticamente:
- Estrutura das Ondas 1 e 2
- Zona de entrada OB
- Sinal de entrada
- Stop Loss baseado no ATR além da Onda 2
- Take Profit baseado na projeção do ATR
Gerenciamento de Risco & Negociação
- Stop Loss e Take Profit são calculados dinamicamente usando ATR
- A relação risco-recompensa é exibida diretamente no gráfico
- Projetado para evitar configurações excessivamente estendidas ou de baixa qualidade
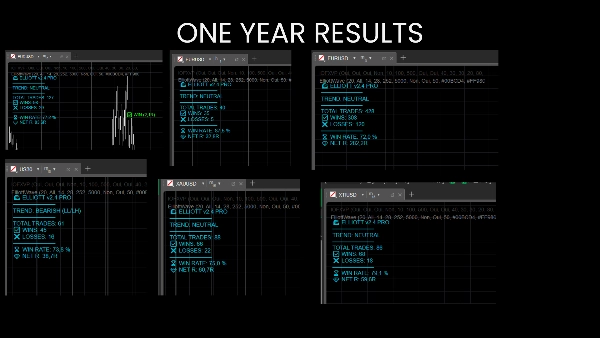
Eu pessoalmente o uso para scalping em índices no M1 & M5, mas também funciona com FX, commodities, ações, etc... O painel mostra se foi lucrativo em um ativo específico.
A versão gratuita permite que você experimente nos principais pares FX M15.