
H Capital Liquidity Map Lite V1
Indicador
250 transferências
Versão 1.0, Mar 2026
Windows, Mac
Descrição
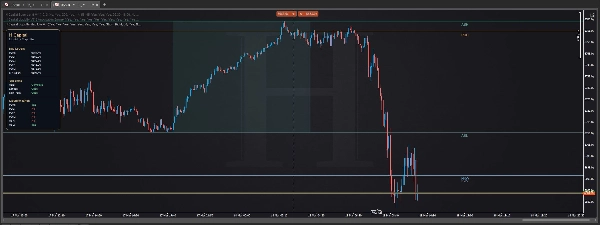
H Capital Liquidity Map Lite é uma ferramenta gratuita de gráficos projetada para traders que querem estrutura sem confusão.
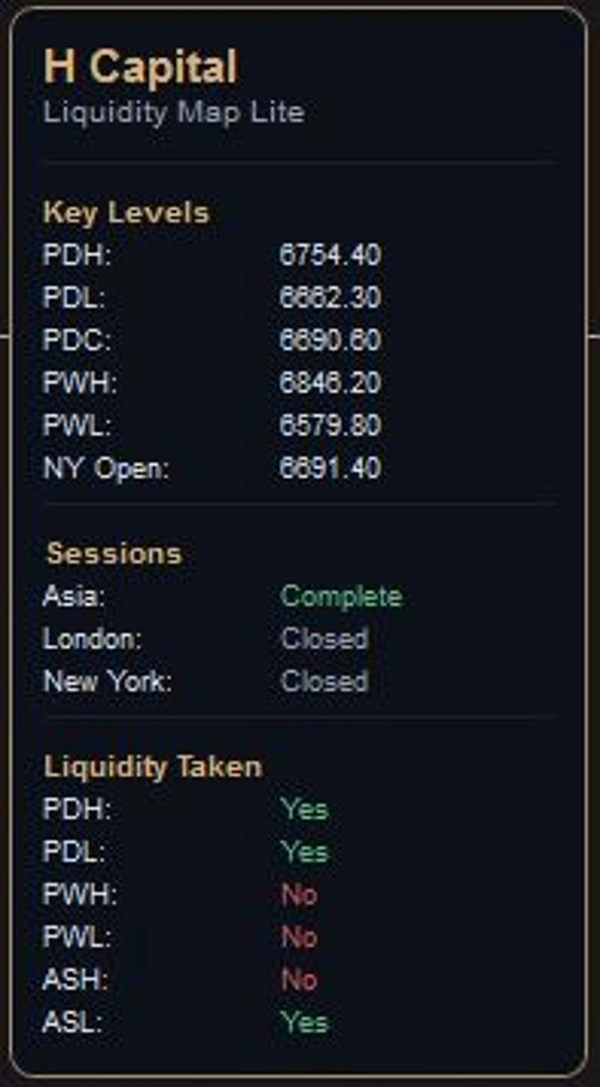
Ela mapeia as principais referências de mercado que muitos traders monitoram todos os dias:
- máxima do dia anterior
- mínima do dia anterior
- fechamento do dia anterior
- máxima da semana anterior
- mínima da semana anterior
- abertura de Nova York
- faixa da sessão da Ásia
- status de liquidez retirada
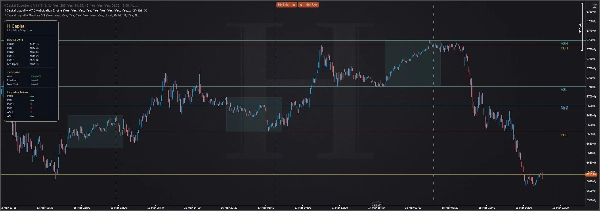
O objetivo é simples: fornecer aos traders uma estrutura limpa antes da execução.
Em vez de inundar o gráfico com sinais, o H Capital Liquidity Map Lite foca nos níveis e referências de sessão que ajudam a construir o contexto. A interface é projetada com um estilo minimalista premium para que o gráfico permaneça legível enquanto a informação continua acessível de relance.
Melhor para:
- traders de índices
- traders de forex
- traders de metais
- traders baseados em liquidez
- traders que preferem gráficos limpos
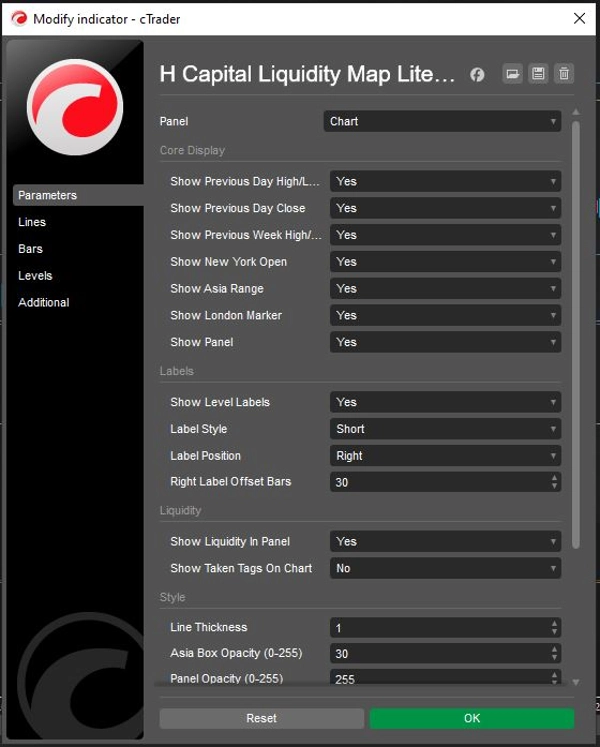
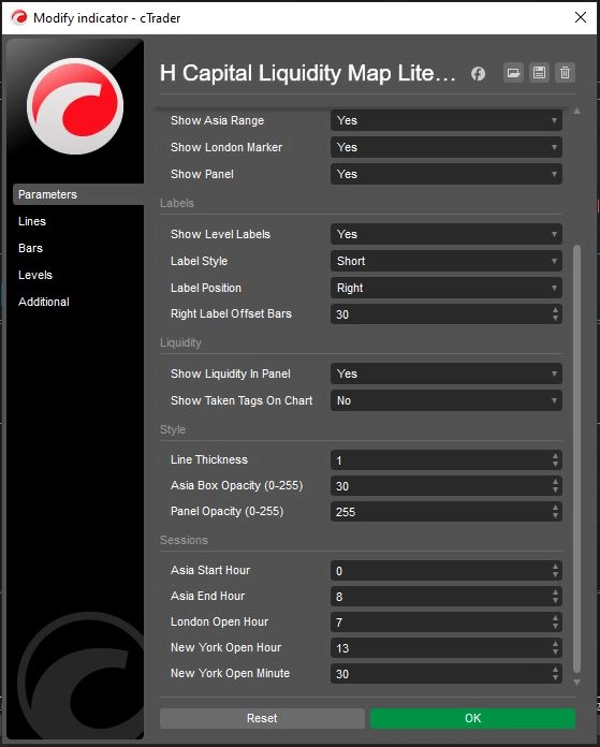
O que faz:
- mapeia níveis-chave de liquidez diários e semanais
- exibe a estrutura da sessão
- acompanha se níveis importantes foram atingidos
- mantém a informação organizada através de um painel premium no gráfico
O que não faz:
- não gera sinais de compra/venda
- não substitui o julgamento na execução
- não funciona como um motor de alertas
Esta não é uma ferramenta de sinais. É um mapa profissional de mercado.
Resumo
Resumo de IA
H Capital Liquidity Map Lite is a charting tool designed to provide traders with a clear, uncluttered view of key daily and weekly liquidity levels. It displays important market references such as the previous day’s high, low, and close; previous week’s high and low; New York open; Asia session range; and liquidity taken status. The tool organizes this information within a minimalist, premium on-chart panel to maintain readability and quick accessibility.
This indicator is suited for traders in indices, forex, metals, and those focusing on liquidity-based strategies who prefer clean chart layouts. It helps build market context by mapping session structures and tracking whether significant levels have been breached. The tool does not generate buy or sell signals, replace execution judgment, or function as an alert system. Instead, it serves as a professional market map to support informed trading decisions.
This indicator is suited for traders in indices, forex, metals, and those focusing on liquidity-based strategies who prefer clean chart layouts. It helps build market context by mapping session structures and tracking whether significant levels have been breached. The tool does not generate buy or sell signals, replace execution judgment, or function as an alert system. Instead, it serves as a professional market map to support informed trading decisions.
Perfil do indicador
Avaliações de clientes
0.0
Avaliações: 0
Avaliações de clientes
Ainda não há avaliações para este produto. Já o experimentou? Seja o primeiro a contar a outras pessoas!
Conversa
Perguntas frequentes
Prop
Forex
Indices
Commodities
Crypto
Grid
Os produtos disponíveis através da cTrader Store, incluindo bots de negociação, indicadores e plugins, são fornecidos por programadores terceiros e são disponibilizados apenas para fins informativos e de acesso técnico. A cTrader Store não é um corretor e não fornece aconselhamento em matéria de investimento, recomendações pessoais ou qualquer garantia de desempenho no futuro.


Preço
Desde 09/03/2026
1.58M
Volume negociado
15.43K
Pips ganhos
250
Instalações gratuitas