Descrição
TeoriaCutrim é um indicador estatístico sobreposto projetado para quantificar o comportamento recente do mercado por meio da distribuição de velas e análise de volatilidade. Em vez de prever a direção, ele fornece dados objetivos sobre o que o mercado acabou de fazer dentro de uma janela configurável de velas.
Dados do Mercado Analisados
O indicador avalia um número definido pelo usuário de velas recentes (período de retrocesso) e extrai:
- Número e porcentagem de velas de alta (fechamento > abertura)
- Número e porcentagem de velas de baixa (fechamento < abertura)
- Diferença entre dominância de alta e baixa
- Média da faixa das velas (em pips)
- Faixa da vela atual (em pips)
- Faixa total de preço na janela analisada
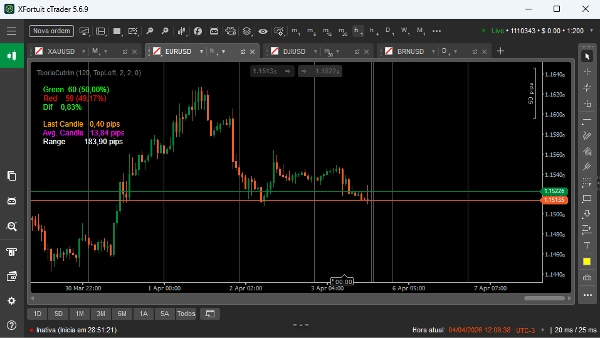
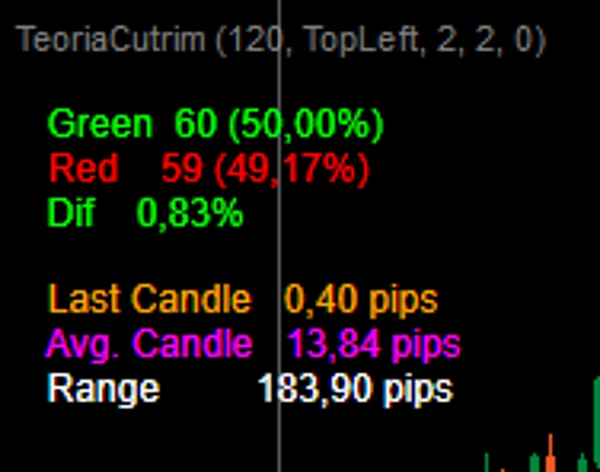
Saída Visual e Interpretação
O indicador exibe métricas chave diretamente no gráfico:
- Verde: total de velas de alta e porcentagem
- Vermelho: total de velas de baixa e porcentagem
- Dif: diferença absoluta entre porcentagens de alta e baixa
- Última Vela: tamanho da vela atual em pips
- Média das Velas: tamanho médio das velas na janela selecionada
- Faixa: distância entre a máxima mais alta e a mínima mais baixa na janela
A interpretação é direta:
- Um número maior de velas de alta sugere pressão recente para cima
- Um número maior de velas de baixa sugere pressão recente para baixo
- Uma diferença baixa (Dif) indica equilíbrio ou aleatoriedade
- Aumento do tamanho médio das velas indica volatilidade crescente
- Faixa total grande sugere expansão do mercado, enquanto faixa pequena sugere compressão
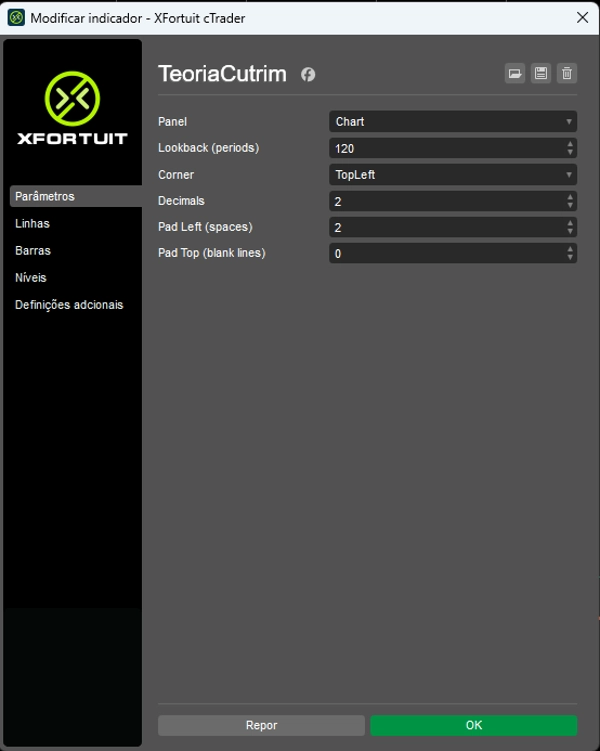
Parâmetros Chave
- Lookback: número de velas usadas para análise (totalmente ajustável)
- Canto: posição na tela da exibição dos dados
- Decimais: número de casas decimais exibidas
- Espaçamento Esquerdo / Espaçamento Superior: ajustes visuais de espaçamento
Casos de Uso
TeoriaCutrim é melhor utilizado como uma ferramenta de contexto, não como um gerador de sinais. Aplicações típicas incluem:
- Medir desequilíbrio estatístico antes de entrar em negociações
- Identificar expansão ou contração da volatilidade
- Filtrar negociações com base no comportamento recente das velas
- Apoiar estratégias quantitativas ou baseadas em probabilidade
Usuário Alvo
Este indicador é projetado para traders que dependem de dados, estatísticas e análise objetiva em vez de reconhecimento subjetivo de padrões. Adequado para traders discricionários e sistemáticos.