present
Sign up and get $50 off your first purchase
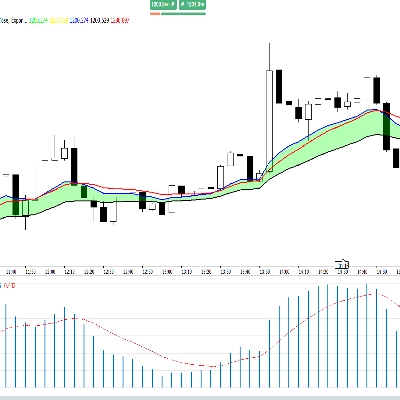
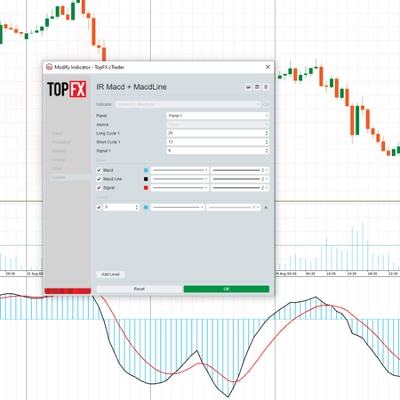
Trading product for IR Macd + MacdLine Indicator MACD, image 1
IR Macd + MacdLine
5.0
Reviews: 2
5.66K
Free installs

Description

some user add moving average to macd to see better.

in ctrader 4.3.11 there is a problem with this .

I make a macd that have macdline for that users

Summary

AI summary
IR Macd + MacdLine is a technical indicator designed for use on the cTrader platform. It enhances the traditional MACD (Moving Average Convergence Divergence) by incorporating a MACD line, addressing issues found in cTrader version 4.3.11 related to adding moving averages to the MACD. This indicator aims to provide clearer visualization of MACD signals by combining the MACD histogram with an additional MACD line, facilitating better momentum analysis. It is categorized under momentum indicators and supports analysis based on MACD histogram and moving average convergence divergence concepts.
Indicator profile

Discussion

Customer reviews

5.0
Reviews: 2
5
100 %
4
0 %
3
0 %
2
0 %
1
0 %
Customer reviews
August 12, 2025
Pros: Clear MACD visualization with extra signal line, customizable, stable. Cons: No alerts, no MTF mode, no auto-signal marking.
April 17, 2025
MACD指标写的比较有特色

FAQ

MACD
Products available through cTrader Store, including trading bots, indicators and plugins, are provided by third-party developers and made available for informational and technical access purposes only. cTrader Store is not a broker and does not provide investment advice, personal recommendations or any guarantee of future performance.
More from this author

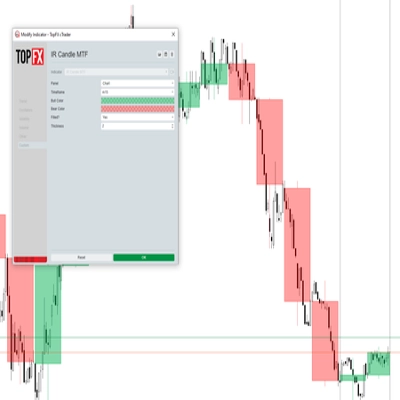
with this indicator you could see other time frame candle in your chart.
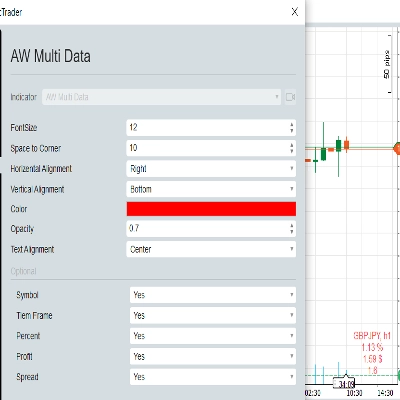
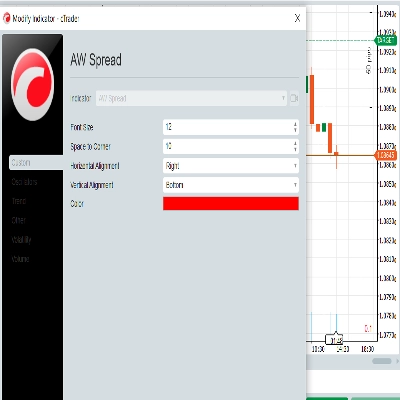
show spread on chart
this indicator show macd on chart.
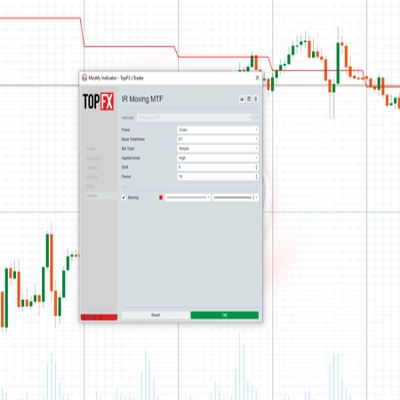
Multi Time Frame Moving Average is a powerful and flexible indicator for cTrader
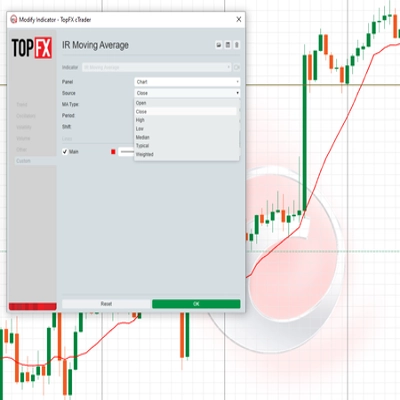
 this moving include everything that a trader needs from Moving Average.
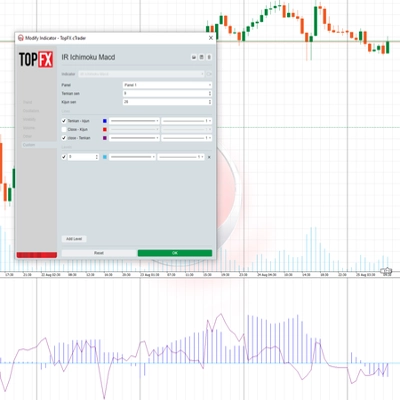
this indicaotr show distance between Tenkan to Kijun, Close to Kijun and Close to Tenkan 
Add Slowing to IR Moving Average.
IR Candle Open plots customizable opening price lines for daily, weekly, and monthly candles
Coral indicator
you could put your check list in your chart you could split your test with “,” you could put your checklist in indicat
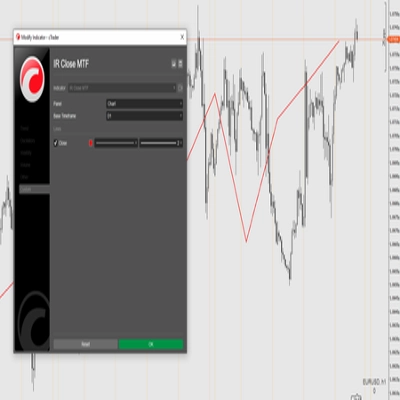
this indicator show other time frame close in lower time frame. for ex: show daily close in m 15.
don't move to the end of chart after timeframe changing. it should be better to use for near history. for long history

You may also like

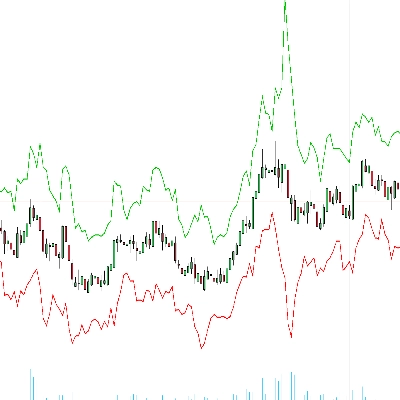
Enhance trading with ATR Bands! Visualize market volatility using dynamic upper and lower ATR bands for precise decision
🚀See the market’s framework, decide faster. Session-Aware Pivots. Auto Presets. Pro-Grade Zones.🚀
Customizable window inside your platform, access to any website Calendar
Easy Trade: Trend & Breakout Indicator for cTrader
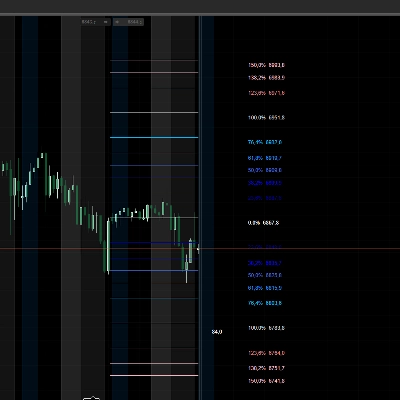
Daily Fibo
This indicator combines two independent analytical engines into a single overlay on your chart.
AI-powered daily range forecasts help traders spot volatility opportunities and plan stops and targets.
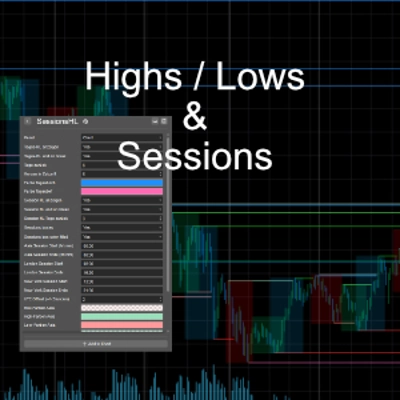
Shows daily and sessions highs / lows and session boxes, everything configurable
RSI Scalping cBot: quick‑fire trades on choppy symbols.
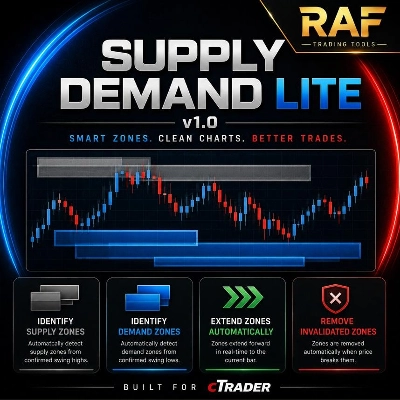
RAF Supply Demand Lite v1.0 automatically detects clean Supply and Demand zones using confirmed swing highs and lows. Zo
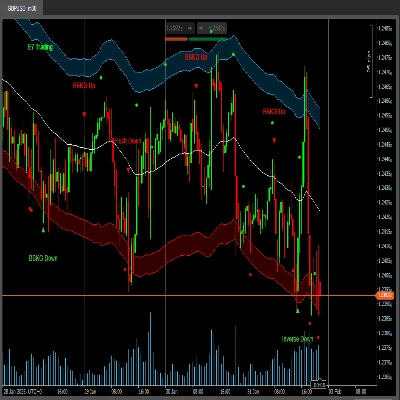
E7 BBKG indicator with 80% plus accuracy used to show both, possible reversal and trend.
Dense EMA rainbow + Pro tools & a tested engine — get more from your EMAs, your research base for EMA bots.
GOLD SENTINEL v1.0 - A CANDLE-COLORING INDICATOR FOR GOLD.
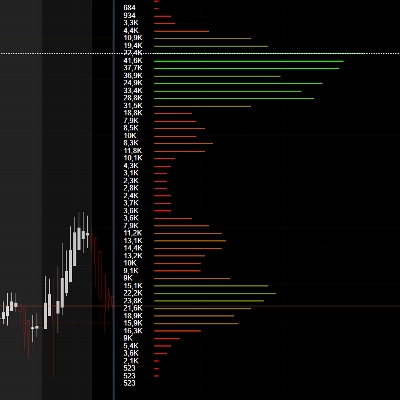
volumen perfile
Map market structure, order blocks, liquidity and key zones with an interactive cTrader dashboard.
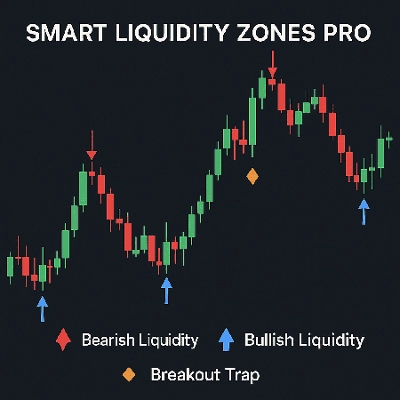
Smart Liquidity Zones PRO auto-detects liquidity grabs, wicks, traps & manipulations — trade like the smart money.
HMA MTF 2.0 (Multi-Timeframe )
VWAP Bands indicator with 3 standard deviation levels, buy/sell zones, and a draggable ON/OFF button to toggle the entir

Price

5.66K
Free installs