present
Registrieren Sie sich und erhalten Sie $50 Rabatt auf Ihren ersten Kauf
Trading product for IR VLine Indikator, image 1
IR VLine
5.0
Bewertungen: 1
5.66K
Kostenlose Installationen

Beschreibung

Nicht zum Ende des Charts nach dem Ändern des Zeitrahmens springen.

Es ist besser, es fĂŒr die nahe Vergangenheit zu verwenden. FĂŒr lange ZeitrĂ€ume gibt es eine Verzögerung.

Zusammenfassung

KI-Zusammenfassung
IR VLine is a chart indicator designed to maintain the current chart position without automatically moving to the end after changing the timeframe. It is optimized for analyzing recent market history, providing timely visual references for near-term data. When applied to longer historical periods, users may experience some delay in updates. This tool supports traders who require stable chart positioning during timeframe adjustments for short-term analysis.
Indikatorprofil

Diskussion

Kundenbewertungen

5.0
Bewertungen: 1
5
100 %
4
0 %
3
0 %
2
0 %
1
0 %
Kundenbewertungen
September 30, 2025
Very useful and handy tool

HĂ€ufig gestellte Fragen (FAQ)

Über den cTrader Store verfĂŒgbare Produkte, einschließlich Handelsbots, Indikatoren und Plugins, werden von externen Entwicklern bereitgestellt und nur zu Informations- und technischen Zugriffszwecken verfĂŒgbar gemacht. cTrader Store ist kein Broker und erbringt keine Anlageberatung, persönlichen Empfehlungen oder eine Garantie fĂŒr zukĂŒnftige Performance.

Mehr von diesem Autor
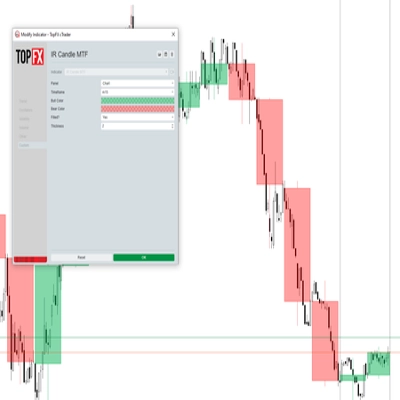
with this indicator you could see other time frame candle in your chart.
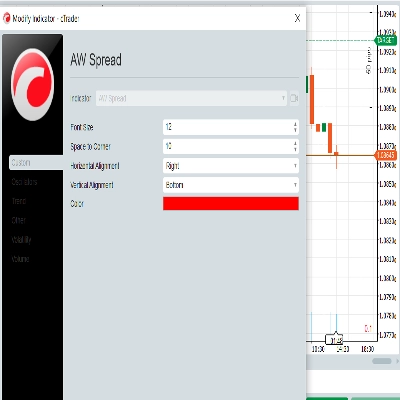
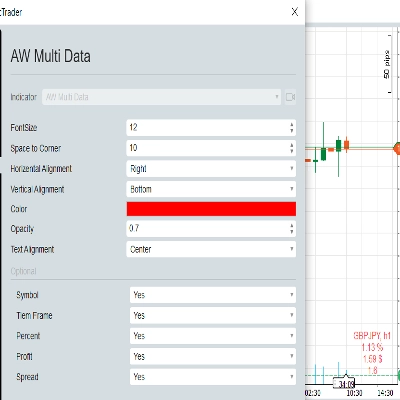
show spread on chart
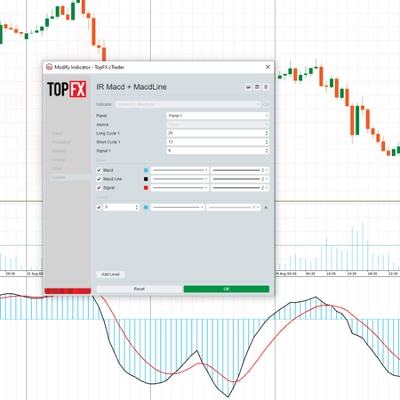
some user add moving average to macd to see better. in ctrader 4.3.11 there is a problem with this . I make a macd tha
this indicator show macd on chart.
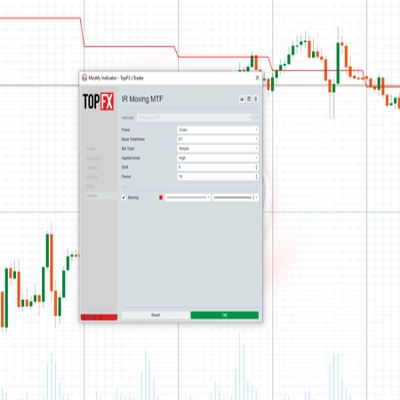
Multi Time Frame Moving Average is a powerful and flexible indicator for cTrader
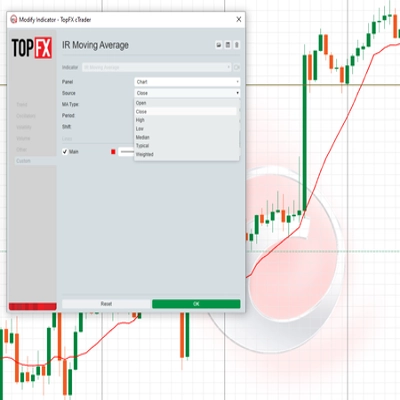
 this moving include everything that a trader needs from Moving Average.
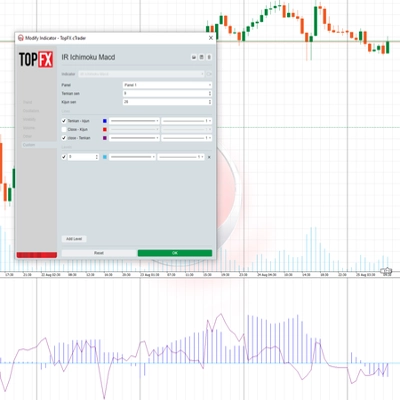
this indicaotr show distance between Tenkan to Kijun, Close to Kijun and Close to Tenkan 
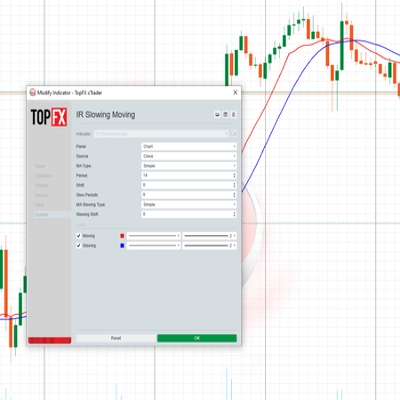
Add Slowing to IR Moving Average.
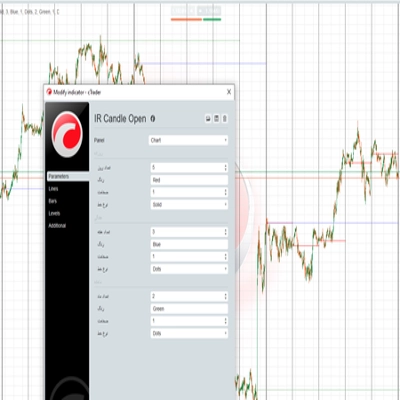
IR Candle Open plots customizable opening price lines for daily, weekly, and monthly candles
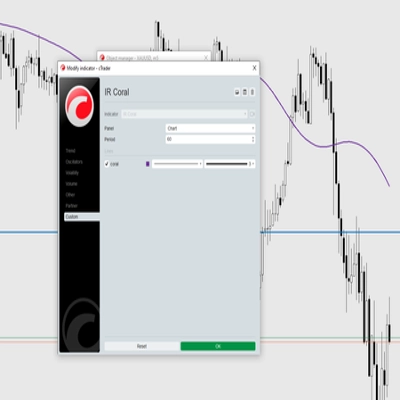
Coral indicator
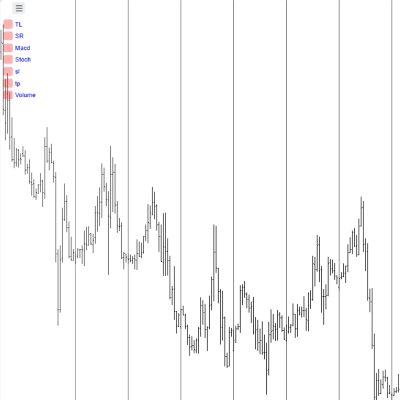
you could put your check list in your chart you could split your test with “,” you could put your checklist in indicat
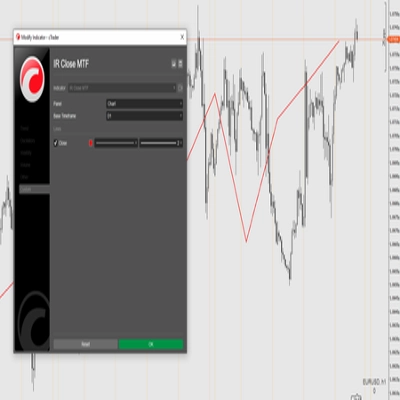
this indicator show other time frame close in lower time frame. for ex: show daily close in m 15.

Das könnte Sie auch noch interessieren

Don't trust static support and resistance levels, this indicator combines Fibonacci and VWAP in one powerful tool.
Trading.FC$_vwap Algo shows VWAP trends, dynamic support/resistance and deviation bands to spot potential trade entries.
Exhaustion Hunter by BeyondTrading — When price hits the limit, the reversal is next.
Nine timeframe cards, vivid candles, native BUY/SELL arrows and adjustable ATR-buffer stop-loss reference lines.
📈 Anchored VWAP with auto High/Low, session resets, Daily VWAP & TWAP — precise, Pine-accurate port.
Highlights market sessions & overlaps with real-time range & volume stats – perfect for pro scalpers.
Map market structure, order blocks, liquidity and key zones with an interactive cTrader dashboard.
institutional-level market analysis
The daily bias estimator indicator uses ICT concepts to show whether the chart is bullish or bearish on multi-time frame
⚡Nebula Range Filter is a professional trend filter indicator for cTrader⚡
Explore Elliott wave counts, three swing sizes and example levels with an interactive cTrader chart panel.
VWAP Bands indicator with 3 standard deviation levels, buy/sell zones, and a draggable ON/OFF button to toggle the entir
Simple ICT Concepts
🎯Identify zones of HIGH INSTITUTIONAL INTEREST: Where there is MORE VOLUME in the breaks, there is GREATER PARTICIPAT..
Session boxes with UTC offset, OR logic, adjustable opacity, and multi-day lookback.
The levels you mark each morning, drawn and followed: PDH/PDL, weekly, monthly, sessions, equal highs/lows.
Multi-timeframe candlesticks!
„VA Footprint“-Logo
4.5
(4)
Ab $19
VA Footprint replaces your chart with a order flow one, the most precise way to read the market.

Preis

5.66K
Kostenlose Installationen