Descrição
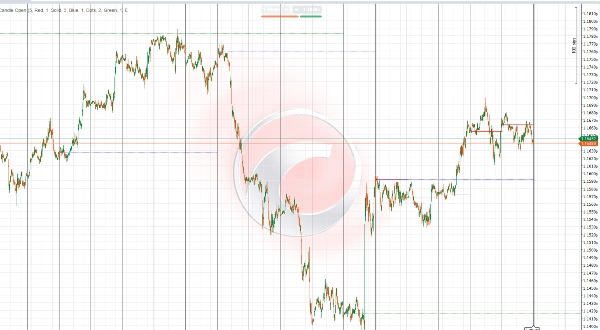
IR Candle Open Indicator é uma ferramenta versátil e personalizável que plota os preços de abertura de velas semanais, diárias e mensais no seu gráfico de negociação. Os traders podem selecionar o número de períodos (dias, semanas, meses) para exibir, permitindo uma análise multi-temporal flexível adaptada à sua estratégia.
As principais características incluem:
- Plotagem precisa das aberturas das velas para números definidos pelo usuário de períodos diários, semanais e mensais.
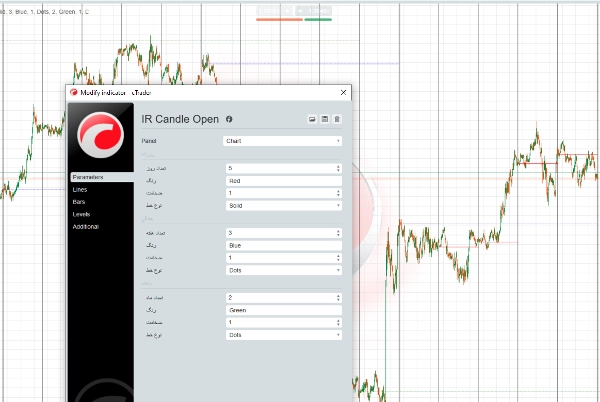
- Estilos de linha personalizáveis: os usuários podem escolher o tipo de linha (sólida, tracejada, pontilhada), cor e espessura para melhor legibilidade do gráfico.
- Suporta visualização multi-temporal para ajudar a identificar níveis importantes de preço em diferentes horizontes temporais.
- Auxilia na identificação de possíveis zonas de suporte e resistência com base nesses preços críticos de abertura.
- Compatível com vários mercados, como Forex, commodities, índices e criptomoedas.
Essa flexibilidade capacita os traders a adaptar a exibição do indicador às suas preferências pessoais e estilo de negociação, aumentando a clareza e melhorando a tomada de decisões com base em níveis cruciais de preço.
توضیح فارسی (بهروز شده)
اندیکاتور IR Candle Open ابزاری منعطف و قابل تنظیم است که قیمتهای باز شدن کندلهای هفتگی، روزانه و ماهیانه را روی نمودار معاملاتی شما نمایش میدهد. کاربران میتوانند تعداد دورههای روزانه، هفتگی و ماهیانه که میخواهند خطوط آنها نمایش داده شود را انتخاب کنند تا تحلیل چندتایمفریمی متناسب با سبک معاملاتی خود داشته باشند.
ویژگیهای کلیدی:
- نمایش دقیق خطوط قیمت باز شدن کندلها برای تعداد دورههای دلخواه در تایمفریمهای روزانه، هفتگی و ماهیانه.
- امکان انتخاب نوع خط (ساده، خطچین، نقطهچین)، رنگ و ضخامت خطوط برای بهبود وضوح و خوانایی نمودار.
- پشتیبانی از تحلیل چندتایمفریمی جهت شناسایی سطوح مهم قیمتی در بازههای زمانی مختلف.
- کمک به تشخیص سطوح حمایت و مقاومت احتمالی بر اساس این نقاط کلیدی باز شدن قیمتها.
- مناسب برای استفاده در بازارهای مختلف مانند فارکس، کالاها، شاخصها و رمزارزها.
این قابلیتها به تریدرها امکان میدهد تا نمایش اندیکاتور را بر اساس سلیقه و سبک معاملاتی خود تنظیم کنند و با وضوح بیشتر، تصمیمات بهتری بگیرند.
Resumo
Avaliações de clientes
5 | 100 % | |
4 | 0 % | |
3 | 0 % | |
2 | 0 % | |
1 | 0 % |