KasePeakOscillator
Indikator
45 downloads
Version 1.0, May 2026
Windows, Mac
5.0
Bewertungen: 1
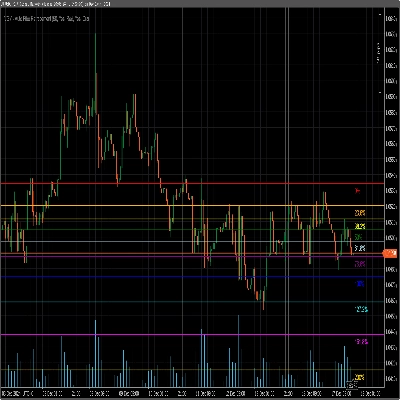
Trading product for KasePeakOscillator Indikator Key Levels Volume, image 2
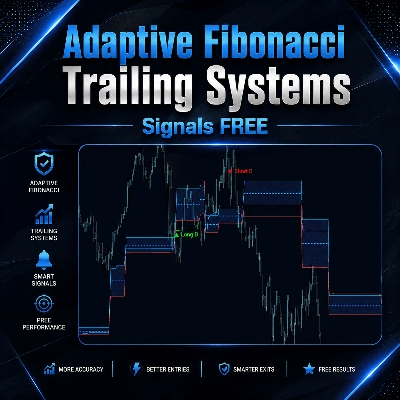
Trading product for KasePeakOscillator Indikator Key Levels Volume, image 3
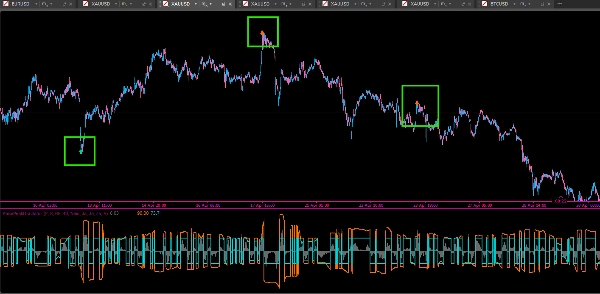
Trading product for KasePeakOscillator Indikator Key Levels Volume, image 4
Seit 21/02/2025
466.3M
Gehandeltes Volumen
180.83K
Pip-Gewinn
22
Verkäufe
6.87K
Kostenlose Installationen

Beschreibung

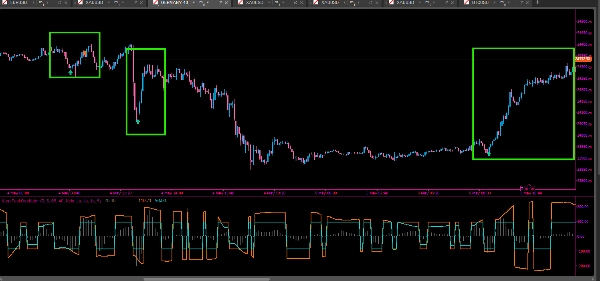
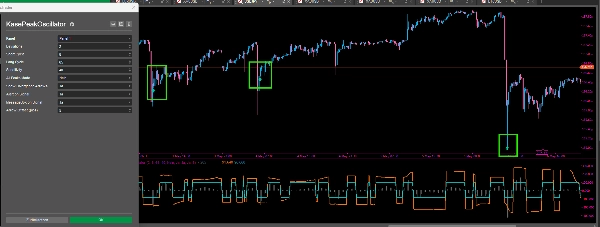
Der KasePeakOscillator (KPO) ist ein ausgeklügeltes Werkzeug der technischen Analyse, das entwickelt wurde, um Markterschöpfung, Trendwenden und Momentumverschiebungen zu identifizieren. Im Gegensatz zu Standardoszillatoren integriert der KPO statistische Volatilitätsmaße, um in unterschiedlichen Marktbedingungen zuverlässigere Signale zu liefern.

Funktionsweise: Der Indikator berechnet die Beziehung zwischen Kursbewegungen und historischer Volatilität (Durchschnittliche Tagesspanne/Standardabweichung). Er bewertet "Kurze Zyklen" gegenüber "Langen Zyklen", um zu bestimmen, ob eine Kursbewegung statistisch signifikant oder lediglich Marktrauschen ist. Das Ergebnis ist ein glatter, reaktionsschneller Oszillator, der um eine Nulllinie oszilliert.

Hauptkomponenten:

  • Das Histogramm (KCD): Stellt das Kernmomentum dar. Ein Überschreiten der Nulllinie zeigt eine Änderung der kurzfristigen Trendneigung an.
  • Dynamische Bänder (Oben/Mitte): Diese fungieren als statistische "überkauft" und "überverkauft" Schwellenwerte. Sie passen sich der Marktvolatilität an, dehnen sich in Phasen hoher Aktivität aus und ziehen sich während Konsolidierungen zusammen.
  • Automatische Spitzen-Erkennung: Der Indikator identifiziert "Spitzen" und "Tiefs", bei denen das Momentum ein statistisches Extrem erreicht, was auf potenzielle Erschöpfung hinweist.

Handelsstrategie:

  1. Spitzenerschöpfung: Wenn ein Momentum-Peak außerhalb der dynamischen Bänder auftritt (angezeigt durch mintgrüne oder orangefarbene Pfeile), deutet dies darauf hin, dass der aktuelle Trend überdehnt ist und eine Umkehr oder Korrektur wahrscheinlich ist.
  2. Divergenzsignale: Der KPO erkennt automatisch bullische und bärische Divergenzen. Eine Divergenz tritt auf, wenn der Kurs ein neues Extrem erreicht, der Oszillator dies jedoch nicht tut, was auf ein nachlassendes Momentum hinweist. Diese sind mit Hellblau (bullisch) und Gold (bärisch) Symbolen gekennzeichnet.
  3. Trendbestätigung: Verwenden Sie die Position des Histogramms relativ zur Nulllinie, um die Trendrichtung zu bestätigen. Ein Verbleib über Null unterstützt Long-Positionen, während ein Verbleib unter Null Short-Positionen unterstützt.

Eigenschaften:

  • Integriertes Alarmsystem (Ton, Nachrichtenfenster und visuelle Symbole).
  • Einstellbare Empfindlichkeit zur Anpassung an verschiedene Anlageklassen (Forex, Indizes, Krypto).
  • "Alle Spitzen Modus" für aggressives Scalping oder gefilterter Modus für Swing-Setups mit hoher Wahrscheinlichkeit.

Zusammenfassung

KI-Zusammenfassung
The KasePeakOscillator (KPO) is a technical indicator designed to detect market exhaustion, trend reversals, and momentum shifts by integrating price action with statistical volatility measures. It calculates the relationship between short-term and long-term price cycles adjusted for historical volatility, producing a smooth oscillator around a zero line.
Key components include:
- Histogram (KCD): Represents core momentum; zero-line crossings indicate short-term trend changes.
- Dynamic Bands: Volatility-adjusted thresholds signaling overbought or oversold conditions.
- Automated Peak Detection: Identifies momentum extremes signaling potential trend exhaustion.
The KPO provides automated alerts for peak exhaustion and divergence signals, marking bullish and bearish divergences when price and momentum disagree. Trend direction can be confirmed by the histogram’s position relative to zero.
Features include adjustable sensitivity for various asset classes such as Forex, indices, and cryptocurrencies, an integrated alert system (sound, message, visual icons), and modes tailored for scalping or swing trading. The indicator supports analysis based on price bars and outputs reversal and divergence signals to assist in trading decisions.
Indikatorprofil
Indikatorkategorie
Momentum
Ausgabetyp
Signale
Datenanforderungen
Nur Balken
Unterstützte Signale
Wendepunkt
Abweichung

Kundenbewertungen

5.0
Bewertungen: 1
5
100 %
4
0 %
3
0 %
2
0 %
1
0 %
Kundenbewertungen
May 27, 2026
Reliable tool with a learning curve This indicator takes a little time to get used to, but once you understand how to read the signals properly it delivers solid results. Works best when combined with support and resistance levels and a clear market structure.

Diskussion

Häufig gestellte Fragen (FAQ)

Key Levels
Volume
Über den cTrader Store verfügbare Produkte, einschließlich Handelsbots, Indikatoren und Plugins, werden von externen Entwicklern bereitgestellt und nur zu Informations- und technischen Zugriffszwecken verfügbar gemacht. cTrader Store ist kein Broker und erbringt keine Anlageberatung, persönlichen Empfehlungen oder eine Garantie für zukünftige Performance.

Mehr von diesem Autor

Indikator
RSI
Forex
+4
High-probability trading signals in the fast-paced world of forex and CFD trading.
Indikator
Prop
Stocks
+4
High-Performance Renko Chart Indicator with Advanced filtering method - built for Renko and candlestick charts.
Indikator
ATR
MSS
+5
Detects ICT Turtle Soup setups — liquidity sweeps with MSS confirmation, ATR filter & kill zone session filter.
Indikator
EMA
RSI
+2
Advanced TDI indicator with Shark Fin signals, chart arrows, MTF RSI, divergence detection and smart alerts.
Indikator
Fibonacci
Key Levels
DailyTargets: Dynamic ADR-based levels & targets. Includes Buy/Sell zones, previous Hi/Lo, and automated trend alerts.
Indikator
SMC
Prop
+15
Automatic Elliott Wave Detection with Professional Filters
Indikator
Key Levels
Order Block
+3
Marks NY session range, detects wick sweeps beyond box edges.. One signal per day. Overlay, no repainting!
cBot
EMA
SL Manager
+5
Fully automated dual-symbol hedging cBot for cTrader.
20.6%
Rendite
8.66
Gewinnfaktor
Indikator
Key Levels
Supertrend
+3
Marks London and New York session opening zones and alerts you instantly on breakouts.
Indikator
MACD
Key Levels
+2
Trend indicator with multi-timeframe filters, generating signals only on fully completed bricks & candles. No Repaint.
Indikator
BOS
Fair Value Gap
+1
ICT Quarterly Theory indicator — color-coded Q1–Q4 session zones with smart entry signals and real-time alerts.
cBot
RSI
Aggressive
automates entries based on the RSX indicator — a smoothed, low-lag variant of the classic RSI.
1.67
Gewinnfaktor

Das könnte Sie auch noch interessieren

Indikator
RSI Scalping cBot: quick‑fire trades on choppy symbols.
Indikator
EMA
SMA
+3
Pro MA Close Alert. Powerful indicator that instantly notifies you when price closes above or below your selected MA.
Indikator
Forex
Identify 34 candlestick patterns, track trends across timeframes, and get instant alerts with this powerful trading tool
Indikator
Volume
Key Levels
+1
Tape Reading indicator ,book and flow analysis
Indikator
Aggressive
Supertrend
+5
Stop trading with tunnel vision! 🚫 The Heat Map Dashboard is an institutional-grade visual trading assistant
Indikator
Prop
Forex
+11
🌊 See when the market is truly in play. Tsunami measures Relative Volume by time-of-day 🌊
Indikator
Order Block
Fair Value Gap
+2
This indicator contains most of the ICT strategies that you need. You can turn on/off each one to be shown.
„supertrend“-Logo
Beliebt
4.3
(3)
$20
Indikator
ATR
Prop
+4
Supertrend Indicator for cTrader
Indikator
Forex
BTCUSD
+10
Enhance trading with TSI! Use the True Strength Index for clear insights into market momentum and trend strength.
Indikator
AI
ATR
+27
The profit and loss of your current trades are always displayed on the chart.
Indikator
VWAP
Volume
+2
VWAP Stdev Heatmap: Advanced daily VWAP with 5-tier standard deviation bands and dynamic candlestick coloring.
Indikator
RSI
Buy at green arrow if trend is bullish and viceversa
Indikator
SMC
Prop
+13
Perfect for traders who demand a clear overview of multiple timeframes at a glance.
Indikator
MSS
Market Structure
+2
Smart structural zones with pivot detection, ATR adaptation, sound alerts, and auto-color UI for precise entries.
Indikator
ATR
Prop
Outside Candle Detector: Highlights major candles/zones with ATR filter & pattern labels. By Avydel Talbo, prop trader.
Indikator
Signal
Hammer Pattern Indicator
Indikator
SMC
Signal
+2
Gold Market Maker Zones; Non-repainting Supply & Demand detector for XAUUSD. Precise institutional zones for cTrader.
Indikator
Indices
Commodities
The Advanced CCI & EMA Indicator combines the CCI with 40 & 80 EMA logic to generate precise arrows signaling direction

Preis

Seit 21/02/2025
466.3M
Gehandeltes Volumen
180.83K
Pip-Gewinn
22
Verkäufe
6.87K
Kostenlose Installationen