Description
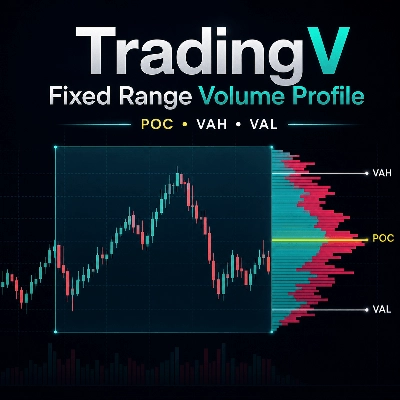
TradingV Fixed Range Volume Profile est un outil professionnel de profil de volume conçu pour aider les traders à analyser où l'activité de trading est concentrée à l'intérieur d'une plage de prix sélectionnée.
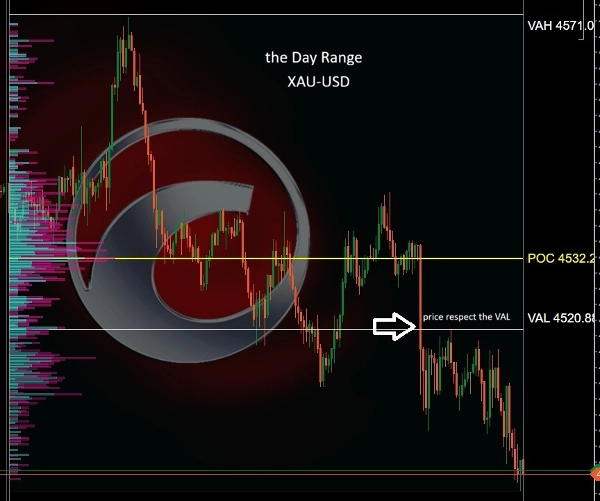
L'indicateur affiche la distribution du volume de la plage choisie et met en évidence les niveaux de structure de marché les plus importants : POC, VAH et VAL. Ces niveaux aident les traders à identifier les zones de haute liquidité, les zones de valeur équitable, les supports et résistances potentiels, ainsi que les zones de réaction importantes pour les entrées, sorties et la gestion des trades.
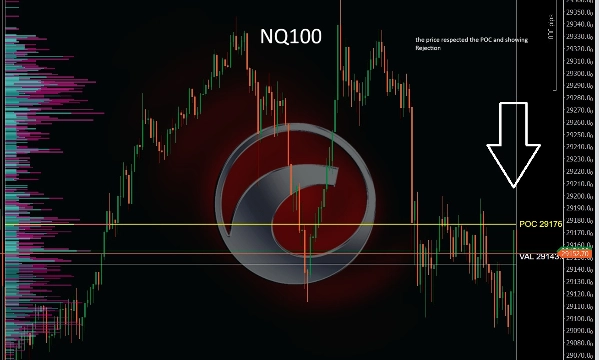
Le profil de volume est largement utilisé par les traders professionnels, et de nombreuses stratégies de trading réussies sont basées sur la compréhension de l'endroit où le volume s'est accumulé, où le prix est accepté et où le prix peut être rejeté. Le POC peut agir comme un point de référence majeur pour l'équilibre du marché, tandis que VAH et VAL aident à définir les limites supérieure et inférieure de la zone de valeur.
Comment utiliser les entrées :
Mode de plage :
Choisissez comment la plage du profil est sélectionnée.
- SessionToday : démarre automatiquement à partir de l'heure de début de session définie et continue jusqu'à la dernière bougie disponible.
- ManualTime : vous permet de définir manuellement l'heure de début et l'heure de fin exactes pour le profil.
- VisibleRange : calcule le profil en fonction de la plage de graphique actuellement visible.
Heure de début de session / Minute de début de session :
Utilisé avec le mode SessionToday pour définir le début de la session de trading. Par exemple, si votre session de marché commence à 01:05, réglez l'heure sur 1 et la minute sur 5.
Heure de début / Heure de fin :
Utilisé avec le mode ManualTime pour définir une plage fixe personnalisée. Si l'heure de fin est laissée vide, l'indicateur utilise la dernière bougie disponible.
Paramètres de couleur :
Personnalisez la couleur du volume à la hausse, la couleur du volume à la baisse, la couleur du POC, la couleur VAH/VAL, l'opacité de la boîte de plage, l'opacité du profil et l'opacité de la zone de valeur pour correspondre à votre style de graphique.
Cas d'utilisation typiques :
- Trouver les zones clés de liquidité à l'intérieur d'une session
- Identifier les limites de la zone de valeur
- Planifier les entrées près du POC, VAH ou VAL
- Gérer les sorties autour des niveaux de volume importants
- Comparer la position actuelle du prix par rapport à la valeur acceptée
- Soutenir les décisions basées sur l'action des prix, le trading intrajournalier, le scalping et le swing trading
Cet indicateur convient aux traders qui utilisent le profil de volume, la structure du marché, la théorie du marché d'enchères, le support et la résistance, ou les méthodes de trading basées sur la liquidité. Il est conçu pour offrir une vue visuelle claire de l'endroit où le marché a négocié le plus de volume à l'intérieur d'une plage fixe.
Note :
TradingV Fixed Range Volume Profile est un outil analytique et ne fournit pas de signaux d'achat ou de vente en soi. Il doit être utilisé conjointement avec votre propre plan de trading, gestion des risques et confirmation du marché.
Résumé
The indicator offers flexible range selection modes:
- SessionToday, which automatically sets the range from a defined session start time to the latest candle;
- ManualTime, allowing custom start and end times;
- VisibleRange, which uses the currently visible chart area.
Users can customize colors for up-volume, down-volume, POC, VAH/VAL, and adjust opacity settings to fit their chart style. Typical applications include locating key liquidity zones, defining value area boundaries, and supporting various trading styles such as intraday, scalping, and swing trading.
TradingV Fixed Range Volume Profile is designed for traders employing volume profile, market structure, auction market theory, or liquidity-based methods. It provides a clear visual representation of volume concentration but does not generate buy or sell signals independently.


