
Prop Firm Rule Tracker
Indicatore
Versione 1.0, Aug 2026
Windows, Mac
5.0
Recensioni: 1
Da 30/05/2026
1
Vendite
Descrizione
Progettato per trader che utilizzano FTMO, MyForexFunds o qualsiasi valutazione di prop firm con regole di perdita giornaliera e drawdown massimo.
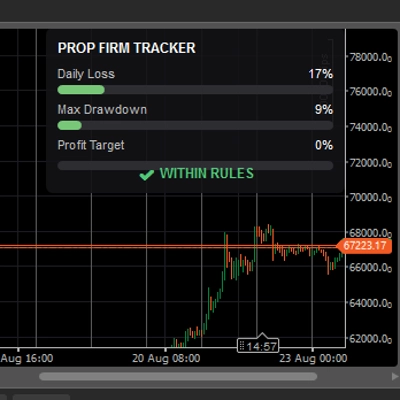
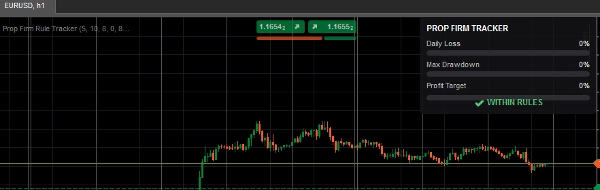
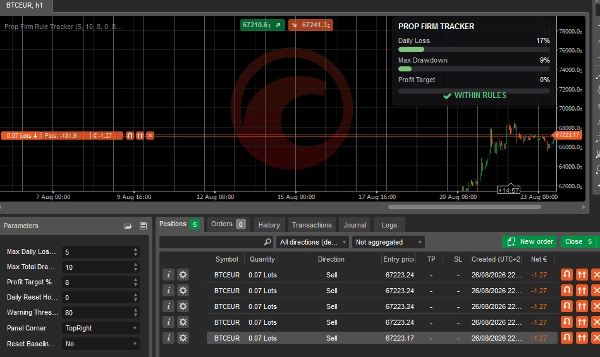
La maggior parte degli "strumenti prop" sono solo indicatori di tendenza con un nome nuovo. Questo invece monitora effettivamente le regole che portano alla squalifica degli account — limite di perdita giornaliera, drawdown totale e obiettivo di profitto — in tempo reale, in un pannello pulito sul grafico.
Caratteristiche:
- Monitoraggio live della % di perdita giornaliera, si resetta all'ora scelta del tuo broker
- Monitoraggio del drawdown massimo dal vero massimo storico dell'account
- Barra di progresso dell'obiettivo di profitto
- Avvisi codificati a colori (verde → ambra → rosso) prima di superare un limite
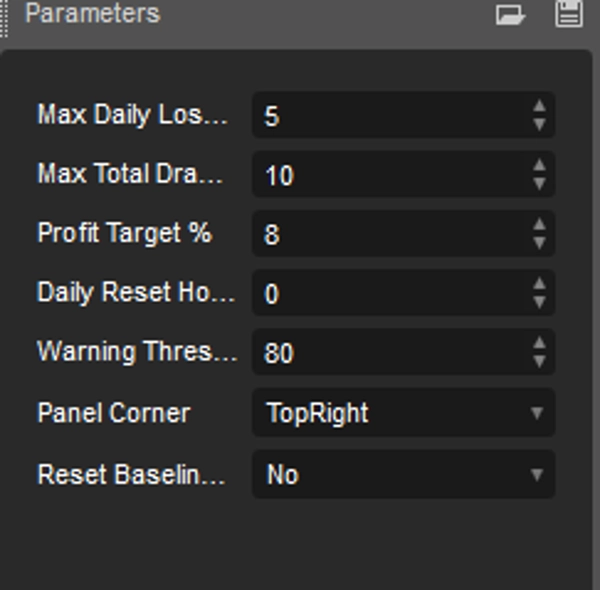
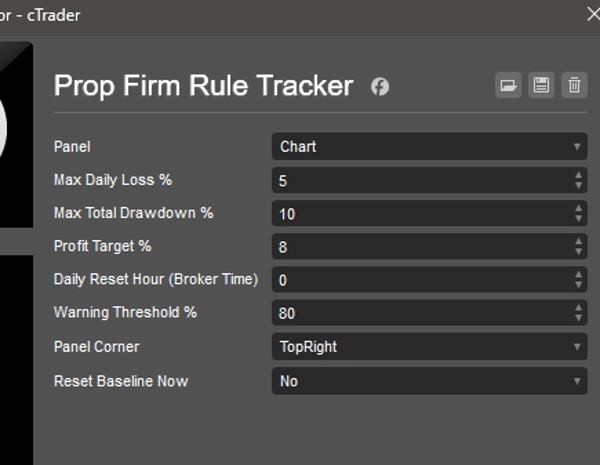
- Soglie configurabili per le regole specifiche di qualsiasi azienda
- Reset manuale della baseline per quando vieni finanziato o inizi una nuova sfida
- Pannello flottante pulito, scegli in quale angolo del grafico posizionarlo
A chi è rivolto: chiunque faccia trading con un account finanziato/di valutazione e voglia un controllo visivo costante senza dover fare calcoli a mente durante la sessione.
Riepilogo
Riepilogo AI
Prop Firm Rule Tracker is a real-time compliance dashboard designed for traders participating in proprietary trading firm challenges such as FTMO and MyForexFunds. It monitors key account metrics that determine challenge eligibility, including daily loss percentage, maximum drawdown from the highest account value, and profit target progress. The tool features a clean, floating on-chart panel that can be positioned in any chart corner and provides color-coded warnings (green to red) as traders approach rule limits. Users can configure thresholds to match specific prop firm rules and manually reset baselines when starting new challenges or after funding. This indicator supports live tracking aligned with the broker’s daily reset hour, offering traders a continuous visual reference to manage risk and compliance without manual calculations during trading sessions.
Profilo indicatore
Categoria indicatore
Statistiche
Tipo di output
Visualizzazione
Requisiti per i dati
Solo barre
Segnali supportati
Divergenza
Discussioni
Recensioni dei clienti
5.0
Recensioni: 1
5 | 100 % | |
4 | 0 % | |
3 | 0 % | |
2 | 0 % | |
1 | 0 % |
Recensioni dei clienti
October 22, 2026
putting daily loss, overall drawdown and the profit objective together with configurable limits and resets makes an excellent challenge monitoring view, with warnings kept separate from broker order restrictions.
Domande frequenti
Breaker Block
Drawdown Monitor
Key Levels
Liquidity Sweep
CHOCH
Risk Dashboard
I prodotti disponibili tramite cTrader Store, inclusi bot di trading, indicatori e plugin, sono forniti da sviluppatori terzi e resi disponibili esclusivamente a scopo informativo e di accesso tecnico. cTrader Store non è un broker e non fornisce consulenze in materia di investimento, raccomandazioni individualizzate o garanzie di risultati futuri.
Altro da questo autore
Potrebbe interessarti anche




Prezzo
Da 30/05/2026
1
Vendite