


Descrição
O Perfil de Volume Rígido divide sua janela de retrocesso em um número fixo de níveis de preço e mostra quanto volume foi negociado em cada um, dividido em pressão de compra e venda.
O QUE ELE DESENHA
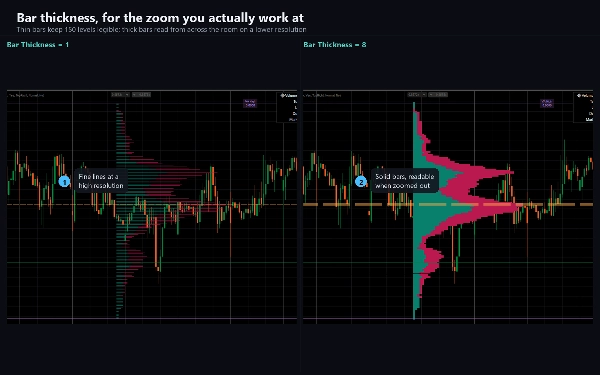
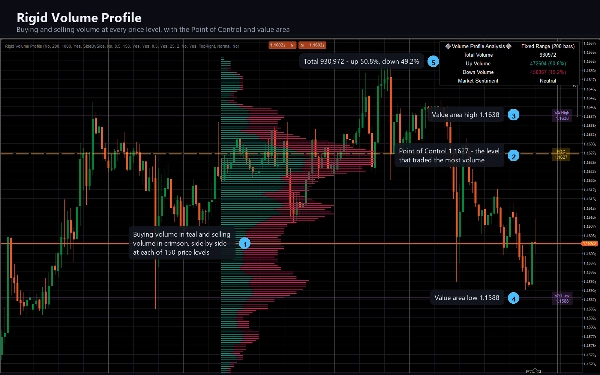
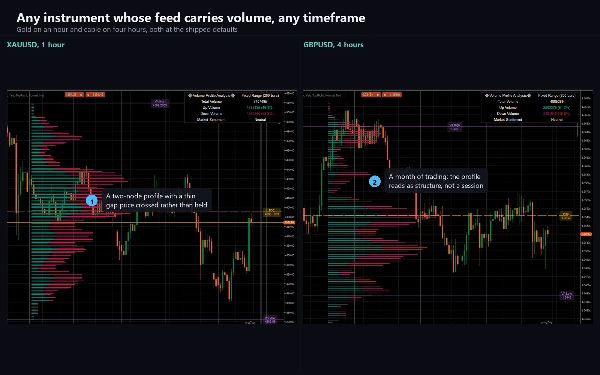
Um histograma horizontal ao lado da ação do preço, construído a partir das últimas N barras. A barra de cada nível é dividida em volume altista (de barras que fecharam em alta) e volume baixista (de barras que fecharam em baixa), para que você possa ver não apenas onde a negociação ocorreu, mas qual lado estava fazendo isso. Barras que fecharam sem alteração dividem seu volume igualmente entre os dois.
Uma linha pontilhada do Ponto de Controle marca o nível de preço que negociou o maior volume na janela, rotulado com seu preço exato.
Duas linhas de área de valor delimitam os níveis que representam 70% do volume da janela, cada uma rotulada.
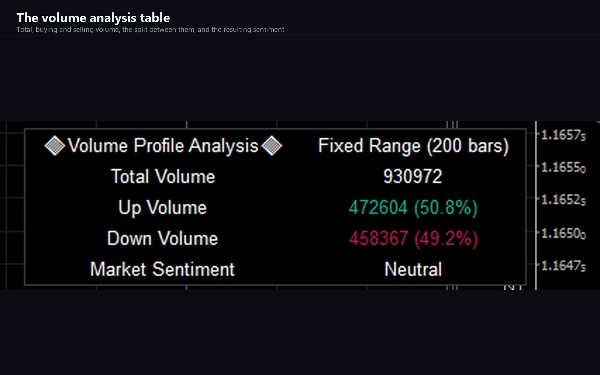
Uma tabela de análise de volume informa o volume total, de alta e de baixa com porcentagens, e uma leitura de sentimento baseada em qual lado domina.
COMO USÁ-LO
Perfis de volume descrevem onde a negociação realmente aconteceu, em vez de onde o preço apenas se moveu. Um nível que absorveu muito volume é um nível que muitos participantes consideram importante; uma parte fina do perfil é uma faixa de preço pela qual o mercado se moveu rapidamente.
Leia o Ponto de Controle como o centro de gravidade da janela. Leia a área de valor como o intervalo onde a maior parte dos negócios foi feita. Leia uma lacuna fina entre dois nós pesados como uma zona que o preço tende a atravessar em vez de permanecer. Observe qual lado da divisão domina um nível quando o preço retorna a ele.
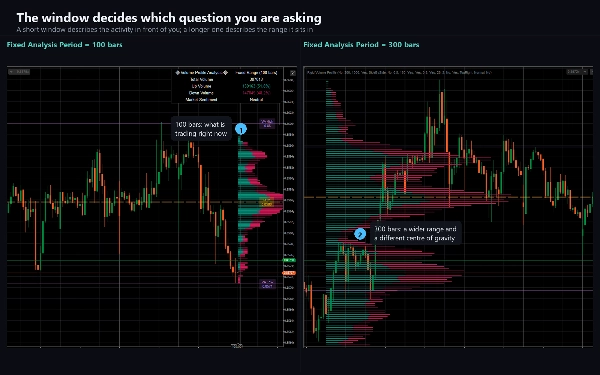
A janela é sua para escolher e a imagem muda com ela, então escolha um retrocesso que corresponda à decisão que você está tomando. Um perfil de 100 barras responde a uma pergunta diferente de um de 500 barras.
CONFIGURAÇÕES PRINCIPAIS
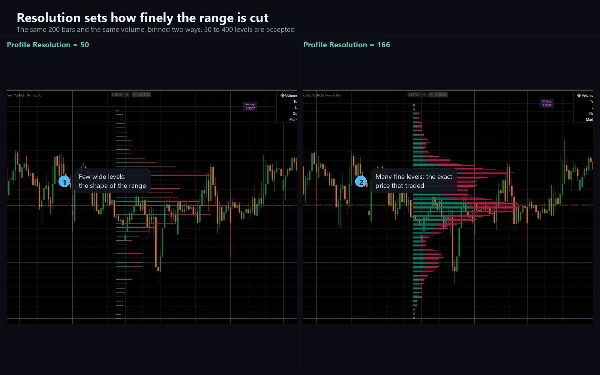
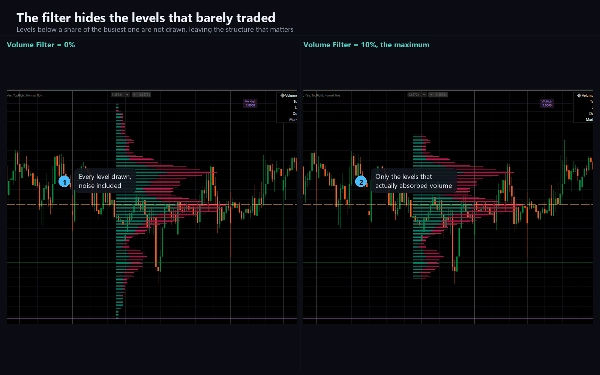
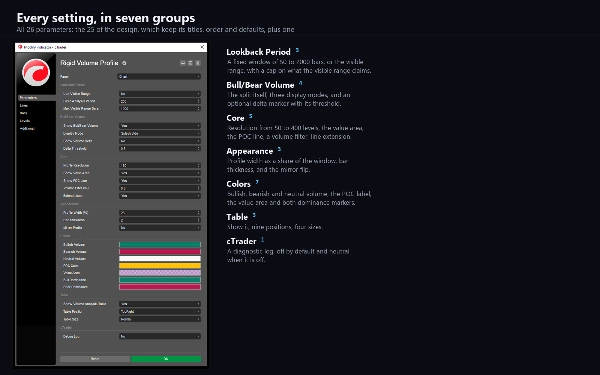
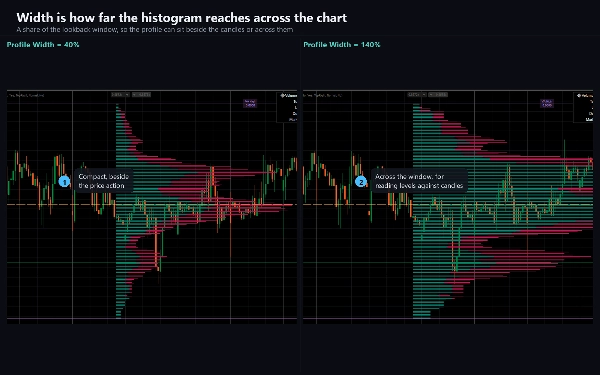
Período de Análise Fixo define o retrocesso em barras, de 50 a 2000. Resolução do Perfil define em quantos níveis de preço o intervalo é dividido, de 50 a 400; menos níveis leem como um perfil clássico, mais oferecem detalhes finos. Modo de Exibição oferece Lado a Lado, Empilhado e Dividido. Largura do Perfil escala o histograma como uma porcentagem do retrocesso. Filtro de Volume oculta níveis abaixo de uma porcentagem do mais movimentado. Mostrar Delta de Volume adiciona um marcador onde um lado claramente domina. Cada cor é ajustável, e a tabela de análise pode ser movida para qualquer uma das nove posições ou desligada.
Usar Intervalo Visível muda o retrocesso para as barras atualmente na tela em vez de uma contagem fixa.
TIPO DE INDICADOR E JANELA
Sobreposição no gráfico. Ele desenha no próprio gráfico de preços, não em um painel separado.
PERÍODOS E INSTRUMENTOS
Qualquer período. É mais útil intradiário, de M5 a H4, onde a distribuição de volume de uma sessão é um objeto significativo.
Funciona em qualquer instrumento cujo feed contenha volume. No forex, isso é volume de ticks, o número de atualizações de preço por barra, que é um proxy para atividade em vez de tamanho negociado. Em CFDs de índices e commodities, alguns corretores fornecem volume real de bolsa, e o perfil é mais significativo ali. Em um instrumento sem volume algum, nada é desenhado.
PARA QUEM É
Traders que já trabalham com perfis de volume e querem um com uma grade fixa ajustável e uma divisão explícita de compra e venda, em vez de um perfil de sessão fixa.
VERSÃO DE TESTE
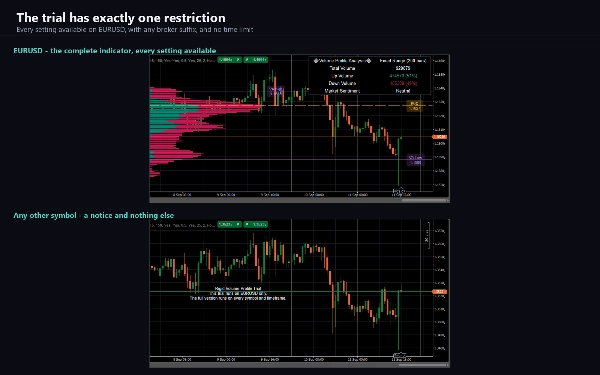
Uma edição de teste está anexada a este produto. É o indicador completo com todas as configurações disponíveis, restrito ao EURUSD. A versão completa remove essa restrição e não adiciona mais nada.
NOTAS TÉCNICAS E LIMITAÇÕES
O perfil é recalculado a cada tick da barra em formação, então o Ponto de Controle e a área de valor se movem dentro de uma barra e se estabilizam quando ela fecha. Isso é intencional. Nada aqui é um sinal de barra fechada.
Com Resolução do Perfil acima de 166, os níveis de preço mais baixos não são desenhados. Isso é um limite deliberado do design, que reserva um conjunto fixo de objetos de desenho e usa três por nível de preço; os botões Mostrar Linha POC e Mostrar Área de Valor liberam cada um um objeto. Mantenha a Resolução do Perfil em 166 ou menos para ver o perfil completo.
A área de valor é construída classificando os níveis por volume e os tomando nessa ordem até atingir 70%, então reportando o preço mais alto e mais baixo entre eles. Portanto, geralmente é mais ampla do que uma área de valor construída caminhando para fora a partir do Ponto de Controle.
Como o perfil é construído a partir do volume do seu corretor, dois corretores não produzirão um perfil idêntico do mesmo mercado.
AccessRights é Nenhum: o indicador não faz ordens, não modifica nada e não lê dados da conta.
SUPORTE
Documentação cobrindo cada parâmetro, as configurações que surpreendem as pessoas e um guia de solução de problemas acompanham o produto. Perguntas são bem-vindas através da aba Discussão; um relatório útil nomeia o símbolo, corretor, período, versão do cTrader e as configurações alteradas do padrão.
Negociar envolve risco. Desempenho passado não garante resultados futuros.
Resumo
Users can customize the lookback period (50 to 2000 bars), profile resolution (50 to 400 levels), display mode (side by side, stacked, split), profile width, and volume filtering. The profile updates dynamically on every tick of the forming bar. It supports any timeframe and instruments with volume data, including tick volume for forex and real exchange volume for some CFDs. The indicator is intended for traders familiar with volume profiles seeking detailed buying and selling pressure insights on a fixed grid rather than session-based profiles. A trial version is available with full features restricted to EURUSD.




























