Descrição
DONCHIAN MARKET & TREND INTELLIGENCE (EDIÇÃO cTRADER)
O Estado do Mercado Institucional, Diagnósticos de Volatilidade & Motor de Tendência Multi-Horizonte para cTrader
PARE DE CHUTAR. COMEÇE A NEGOCIAR COM PRECISÃO QUANTITATIVA.
A maioria dos sinais de rompimento falha porque os indicadores padrão tratam cada pico de preço da mesma forma.
Este motor mede a compressão da volatilidade, o alinhamento estrutural da tendência e o seguimento real do fluxo de ordens antes que você arrisque um único dólar.
Saiba em menos de três segundos se um movimento é uma expansão institucional genuína ou uma armadilha de liquidez planejada.
Pare de olhar para linhas de canal cegas que se redesenham.
Comece a negociar com inteligência completa do mercado.
POR QUE A MAIORIA DOS INDICADORES TRADICIONAIS FALHA COM VOCÊ (E DRENAM SUA CONTA)
Você conhece esse cenário muito bem.
Você fica na frente da tela, vendo o preço avançar agressivamente além de uma máxima estabelecida. Indicadores padrão piscam verde. Você entra comprado. Três velas depois, o momentum desaparece completamente, o preço colapsa de volta para a faixa, e seu stop loss é atingido em um falso rompimento clássico.
Indicadores tradicionais deixam você voando às cegas:
- Eles atrasam dezenas de barras, alertando você somente depois que o movimento já está esgotado.
- Eles se redesenham ou movem dinamicamente seus limites no meio da vela, mudando as metas quando você mais precisa de clareza.
- Eles criam confusão no gráfico, forçando você a lidar com 5 a 10 indicadores conflitantes que causam paralisia na análise.
E se seu gráfico realizasse uma auditoria quantitativa contínua em cada barra fechada—medindo velocidade da volatilidade, limpeza verdadeira dos limites e concordância de tendência multi-horizonte automaticamente?
APRESENTANDO SEU TERMINAL QUANTITATIVO NO GRÁFICO
Conheça o Motor de Inteligência de Mercado & Tendência (Edição cTrader).
Este é um terminal diagnóstico institucional unificado construído nativamente dentro do cTrader, transformando a ação de preço bruta em inteligência de mercado acionável.
Em vez de tratar as linhas de limite como simples marcadores visuais, este motor usa limites de preço não deslocados estritamente como um auxiliar de linha de base—executando modelos matemáticos avançados sobre percentis históricos de volatilidade, derivadas da taxa de variação, eficiência direcional e momentum estrutural.
Pense nele como um computador de voo a bordo e detector de mentiras para seus gráficos. Ele não apenas mostra onde o preço está; ele avalia como o preço chegou lá, se a volatilidade suporta a expansão e se o fluxo de ordens subjacente possui o poder estrutural para sustentar o movimento.
CLAREZA INSTANTÂNEA DO MERCADO EM 3 SEGUNDOS: O DISPLAY HEADS-UP (HUD)
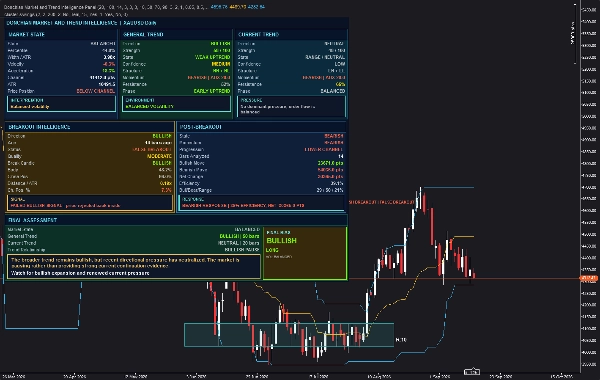
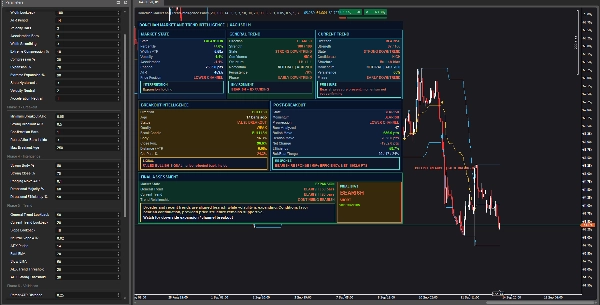
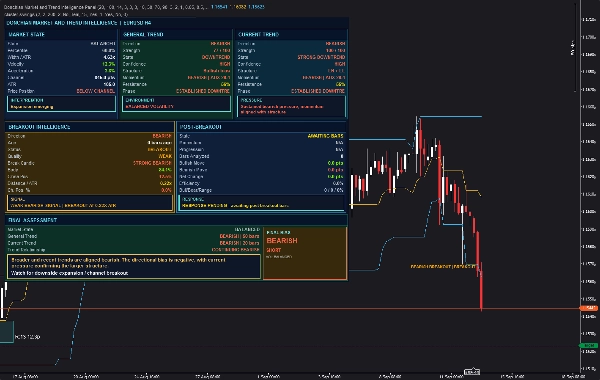
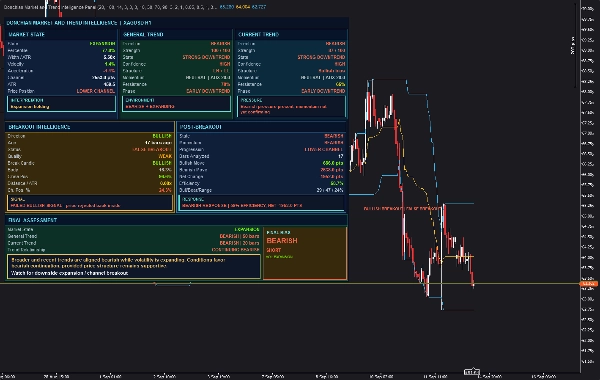
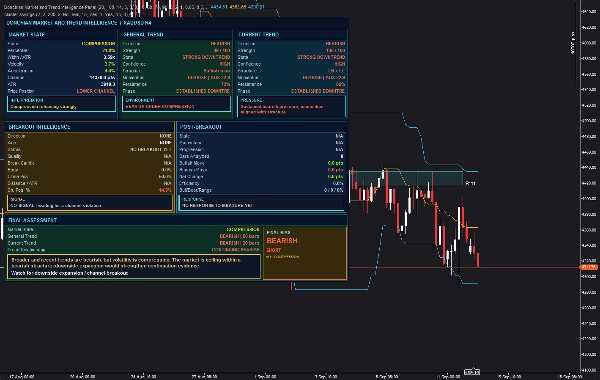
Projetado nativamente para a interface moderna do cTrader, o HUD integrado fornece diagnóstico instantâneo do mercado contra qualquer tema escuro de gráfico sem poluir seu espaço de trabalho.
texto
+----------------------------------------------------------------------------------------------------+
| DONCHIAN MARKET AND TREND INTELLIGENCE | EURUSD H1 |
+------------------------------------+-----------------------------------+---------------------------+
| [ MARKET STATE ] | [ GENERAL TREND ] | [ CURRENT TREND ] |
| State: EXTREME COMPRESSION | Direction: BULLISH | Direction: BULLISH |
| Percentile: 8.4% | Strength: 82 / 100 | Strength: 76 / 100 |
| Width/ATR: 3.12x | Confidence: HIGH | Confidence: HIGH |
| Velocity: +4.2% | Structure: HH + HL | Structure: HH + HL |
| Price Pos: UPPER CHANNEL | Momentum: BULLISH | ADX 32.4 | Momentum: BULLISH |
| > "Compression releasing strongly" | > "BULLISH UNDER COMPRESSION" | > "Sustained pressure" |
+------------------------------------+-----------------------------------+---------------------------+
| [ BREAKOUT INTELLIGENCE ] | [ POST-BREAKOUT METRICS ] |
| Status: VALID CONTINUATION | Age: 4 bars ago | Efficiency: 68.4% |
| Break Dist: 0.84x ATR | Quality: STRONG | Net Travel: +42.5 pts |
| Candle: STRONG BULLISH | Close Pos: 88.2% | Bull/Bear/R: 75/25/0 % |
| > STRONG BULLISH SIGNAL | VALID AT 0.84X ATR | > BULLISH RESPONSE |
+------------------------------------------------------------------------+---------------------------+
| [ FINAL ASSESSMENT ] | [ FINAL BIAS ] |
| Deduction: Broader and recent trends aligned. Volatility expanding. | BULLISH |
| Watch: Watch for sustained upside expansion and structural holds. | [ LONG BIAS ] |
+------------------------------------------------------------------------+---------------------------+
- Ambiente Macro de Volatilidade (Canto Superior Esquerdo): Responde "Em qual regime de mercado estamos?" Avalia percentis históricos de compressão e derivadas matemáticas da taxa de variação.
- Matriz de Tendência Dual-Horizonte (Canto Superior Direito): Responde "A tendência ampla está apoiando a pressão imediata?" Desacopla oscilações estruturais macro do momentum imediato.
- Análise Forense de Rompimento & Execução (Linha do Meio): Responde "Este movimento é real ou uma armadilha?" Disseca a mecânica do corpo da vela, deslocamento além dos limites de preço não deslocados e acompanha a eficiência pós-rompimento barra a barra.
- Síntese Tática Acionável (Linha Inferior): Responde "Qual é o viés definitivo de negociação agora?" Sintetiza dados multifatoriais complexos em uma dedução clara, uma condição exata de observação e um selo de negociação de alta convicção (LONGO, CURTO, ou LEITURA DIVIDIDA).
POR DENTRO: 4 MOTORES ANALÍTICOS DE NÍVEL INSTITUCIONAL
1. O MOTOR DE VOLATILIDADE & COMPRESSÃO DE REGIME
- Pontuação Percentil de Volatilidade Histórica: Normaliza a largura do canal contra o Average True Range (ATR) em um período personalizável (padrão: 100 barras) para calcular um percentil exato de volatilidade de 0–100%. Você sabe instantaneamente se o mercado está enrolado em uma compressão EXTREMA ou estendido em uma expansão EXTREMA.
- Dinâmica da 1ª & 2ª Derivada (Velocidade & Aceleração): Usa inclinações de regressão linear para medir a velocidade (Velocidade) e aceleração da expansão da volatilidade. Você detecta energia acumulada antes do rompimento ocorrer, capturando o movimento enquanto o momentum cinético explosivo é liberado.
- Classificação de Regime Estabilizada por Histérese: Emprega buffers matemáticos de histérese (padrão: 3,0%) nas transições de estado para evitar mudanças rápidas e distrativas de sinal durante condições instáveis.
2. ANÁLISE FORENSE & VALIDAÇÃO DE ROMPIMENTO
- Mecânica Estrita de Limites da Barra Anterior Não Deslocada: Avalia eventos de rompimento contra extremos calculados estritamente antes da barra avaliada. Isso impede que a vela de rompimento mova seus próprios limites, preservando a integridade matemática absoluta.
- Limiares de Limpeza Normalizados pelo ATR: Exige que os fechamentos das barras ultrapassem os limites do canal por um múltiplo exato do ATR (≥0,05×ATR para qualificação; ≥0,50×ATR para classificação forte), filtrando instantaneamente ruídos insignificantes de sub-pip.
- Detecção Automática de Falsos Rompimentos, Retestes & Varreduras de Liquidez: Acompanha ativamente a ação de preço pós-sinal para categorizar movimentos em VÁLIDO, RETESTADO, VARREDO (rejeição de pavio ≥35%), ou FALSO ROMPIMENTO (preço rejeitado para dentro).
3. RASTREADOR DE DERIVA & EFICIÊNCIA PÓS-ROMPIMENTO
- Razão de Eficiência do Deslocamento Direcional: Mede a distância líquida ganha em relação ao movimento bruto total do preço em todas as barras após um rompimento. Você pode distinguir instantaneamente corridas institucionais limpas (≥50% eficiência) de distribuições instáveis e de baixa probabilidade.
- Análise Composição Barra a Barra: Audita cada barra subsequente como de Alta, Baixa ou em Faixa, mostrando se compradores ou vendedores mantêm controle persistente vela após vela.
4. PONTUAÇÃO DE TENDÊNCIA DUAL-HORIZON & ESTRUTURAL
- Avaliação de Tendência Multi-Lookback Desacoplada: Audita simultaneamente a estrutura ampla do mercado (Tendência Geral, padrão: 50 barras) junto com o fluxo de ordens imediato (Tendência Atual, padrão: 20 barras) para mantê-lo do lado certo do fluxo macro.
- Matriz de Pontuação de Tendência Multifatorial: Combina geometria de oscilações estruturais (Máximas e Mínimas Mais Altas vs Máximas e Mínimas Mais Baixas), inclinação da EMA normalizada pelo ATR, persistência direcional e alinhamento vetorial ADX/DMS em uma pontuação objetiva de 0–100.
CONSTRUÍDO COM RIGOR INSTITUCIONAL: ZERO REDESENHO, ZERO COMPROMISSOS
- Execução 100% Sem Redesenho: Algoritmos analíticos principais executam em barras fechadas (
index - 1). O que você vê em gráficos históricos corresponde à execução ao vivo tick a tick. - Arquitetura Nativa C# Sub-Milissegundo: Construída de forma limpa para a API cTrader (.NET). Sem DLLs externas, sem requisições web na nuvem e sem atraso no gráfico.
- Rastreamento de Preço ao Vivo Sensível a Tick: Estados analíticos permanecem bloqueados em barras fechadas para eliminar falsos alarmes, enquanto as coordenadas de posição do preço atualizam dinamicamente a cada tick ao vivo.
- Compatibilidade Universal de Instrumentos: Escala automaticamente em Forex, Cripto, Índices, Metais e Energias via tamanho de tick nativo e normalização ATR.
- Memória Persistente do Ciclo de Vida do Evento: Rastreia, confirma e encerra ciclos de rompimento de forma inteligente, reanalisando apenas o histórico de preço novo após invalidação do evento.
- Alertas Nativos Instantâneos: Receba notificações pop-up em tempo real e sinais de áudio direcionais quando configurações válidas ocorrerem.
4 MANUAIS DE NEGOCIAÇÃO DE ALTA PROBABILIDADE QUE VOCÊ PODE USAR HOJE
- Manual 1: A Expansão da Compressão de Volatilidade
A Configuração: O preço consolidou por horas. O painel exibe COMPRESSÃO EXTREMA (Percentil < 10%) com Velocidade e Aceleração ficando positivas.
A Ação: Você se prepara para uma expansão explosiva. Quando uma barra fecha fora do limite anterior com uma vela FORTEMENTE ALTISTA e limpeza >0,50×ATR, você entra comprado cedo—surfando a onda enquanto outros ainda esperam confirmação. - Manual 2: Filtrando a Varredura de Liquidez Institucional
A Configuração: O preço ultrapassa a resistência, mas a vela de rompimento imprime um pavio superior longo (≥35% do alcance total). Na barra seguinte, o motor sinaliza o status como VARREDO e o preço fecha de volta dentro do canal.
A Ação: Em vez de ficar preso comprando no topo, você evita a operação longa completamente—ou executa um curto contra-tendência rápido de volta para a mediana. - Manual 3: O Reteste da Tendência Multi-Horizonte
A Configuração: A Tendência Geral mostra FORTE TENDÊNCIA DE ALTA (Pontuação > 80/100, Alta Confiança), enquanto a Tendência Atual mostra um RECUO BAIXISTA temporário. O preço recua para o limite superior, mantém-se sem fechar dentro, e o painel pisca RETESTADO.
A Ação: Você executa uma entrada de continuação de alta convicção alinhada com a tendência macro dominante com um nível de invalidação definido e apertado. - Manual 4: Auditoria de Saúde & Momentum do Rompimento
A Configuração: Você está vendido após uma queda. Cinco barras depois, o painel Pós-Rompimento mostra Eficiência: 78%, Movimento Baixista: 85%, e Progressão: CANAL INFERIOR.
A Ação: O motor confirma forte seguimento e zero atrito oposto. Você deixa seus ganhos correrem com total confiança em vez de fechar prematuramente.
DO ABRIR DO GRÁFICO AO NEGÓCIO DE ALTA CONVICÇÃO EM 5 PASSOS SIMPLES
- Verifique o Estado do Mercado: Olhe para o painel no canto superior esquerdo. Estamos em Compressão (enrolamento), Expansão (tendência ativa) ou condições Balanceadas?
- Confirme o Alinhamento Multi-Horizonte: Verifique os painéis de Tendência Geral e Atual. Ambos os horizontes estão piscando a mesma cor e mostrando Alta Confiança?
- Inspecione a Qualidade do Rompimento: Quando o preço testa um limite, verifique o painel de Inteligência de Rompimento. Verifique a estrutura da vela, a distância de limpeza ATR e certifique-se de que o status seja VÁLIDO (não VARREDO ou FALSO).
- Audite a Eficiência do Seguimento: Revise o painel Pós-Rompimento. Procure uma pontuação de Eficiência ≥50% para confirmar o compromisso institucional.
- Leia o Viés Final: Verifique o cartão de Avaliação Final para a direção do seu negócio (LONGO / CURTO), leia a dedução tática e execute com gestão disciplinada de risco.
TOTALMENTE OTIMIZADO PRONTO PARA USO — PERSONALIZÁVEL PARA QUALQUER ESTILO
Os parâmetros padrão são calibrados quantitativamente para análise de mercado de nível institucional em timeframes padrão H1/H4. Ajuste qualquer configuração para combinar com sua classe de ativo ou estilo de negociação específico:
- Configurações de Linha de Base do Limite: Ajuste o lookback de referência da linha de base (Padrão:
20). - Parâmetros de Volatilidade & Regime: Configure o lookback percentil histórico (
100), suavização (3), períodos ATR (14), lookbacks de derivadas (3), e limiares de compressão/expansão (10%,30%,70%,90%com3,0%de histérese). - Análise Forense de Rompimento & Vela: Defina múltiplos de qualificação ATR (Mínimo:
0,05x, Forte:0,50x), regras de confirmação (1 barra), horizontes de aposentadoria (3 barras internas), e filtros de força do corpo da vela (60% do corpo,75% da posição de fechamento). - Pontuação de Tendência & Calibração Estrutural: Personalize o lookback macro (
50), lookback micro (20), limiares ADX (20,0/30,0), suavização dupla EMA (20/50), e sensibilidade do pavio de varredura (35%). - Personalização Visual do HUD & Alertas: Ajuste a posição do painel no canto (TopoEsquerdo, TopoDireito, InferiorEsquerdo, InferiorDireito), largura do painel, escala da fonte, quebra de texto de insights, etiquetas do gráfico e alertas de áudio/pop-up.
O QUE VOCÊ RECEBE HOJE: SUÍTE COMPLETA DE NEGOCIAÇÃO & GUIA DE ESTRATÉGIA GRATUITO
- Acesso Completo ao Indicador Market & Trend Intelligence para cTrader (.NET)
- BÔNUS GRATUITO: O Guia Completo de Estratégia & Uso (PDF)
Incluído gratuitamente com cada compra. Este guia abrangente orienta você por planos completos de configuração, manuais de ciclos de volatilidade, modelos de reversão de falso rompimento e ajuste passo a passo de parâmetros para diferentes classes de ativos. - Atualizações & Melhorias Vitalícias: Todas as melhorias e otimizações futuras estão incluídas sem custo adicional.
- Suporte Dedicado ao Desenvolvedor: Assistência direta para configuração, configuração e dúvidas sobre recursos.
ATUALIZE SEU ESPAÇO DE TRABALHO cTRADER HOJE
Os mercados não esperam você se sentir pronto.
A cada sessão de negociação, o capital é transferido de traders de varejo que chutam em gráficos confusos para traders disciplinados que utilizam inteligência de mercado objetiva e multifatorial.
Você pode continuar lutando com indicadores que se redesenham, sinais conflitantes e falsos rompimentos frustrantes. Ou pode equipar sua plataforma cTrader com um motor de inteligência de nível institucional que decodifica volatilidade, valida rompimentos e quantifica a estrutura da tendência em cada barra.
Clique em "Comprar" para obter acesso instantâneo, baixar seu Guia de Estratégia Gratuito e elevar seus gráficos cTrader a um padrão institucional hoje.
Indicador cTrader | Motor de Inteligência de Mercado | Detector de Compressão de Volatilidade | Ferramenta de Confirmação de Rompimento | Painel de Tendência Sem Redesenho | Análise de Tendência Multi-Timeframe | Filtro de Volatilidade ATR | Detector de Varredura de Liquidez | Análise Forense de Ação de Preço | Terminal de Negociação Institucional
Resumo
Key features include a dual-horizon trend matrix that decouples broad market structure from immediate momentum, breakout forensics that validate moves against strict prior-bar boundaries and ATR-normalized thresholds, and a post-breakout drift tracker measuring directional efficiency and bar-by-bar control. The dashboard synthesizes these data points into a clear final trade bias with actionable insights.
The tool supports universal instrument compatibility across Forex, Crypto, Indices, Metals, and Energies, and offers customizable parameters for boundary lookbacks, volatility thresholds, breakout criteria, and trend scoring. It provides a native, non-repainting C# implementation optimized for cTrader, featuring a clean heads-up display (HUD) with real-time updates and native alerts.
Included are four high-probability trading playbooks addressing volatility squeeze expansions, liquidity sweeps, multi-horizon trend retests, and breakout momentum audits, plus a comprehensive strategy guidebook. This indicator transforms raw price action into quantitative market intelligence to assist traders in making informed decisions.