present
Registe-se e receba 50 $ de desconto na sua primeira compra
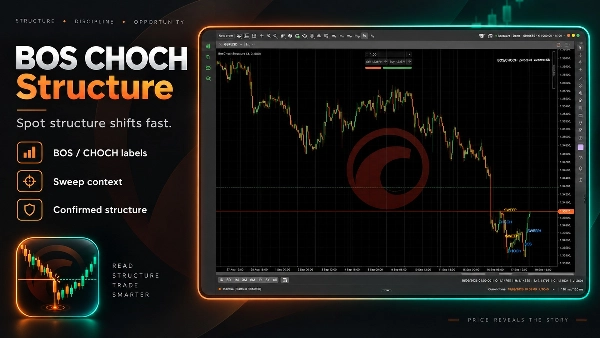
Trading product for BOS CHOCH Structure Indicador Key Levels MSS, image 1
BOS CHOCH Structure
Indicador
Versão 1.0, Sep 2026
Windows, Mac
4.5
Avaliações: 4
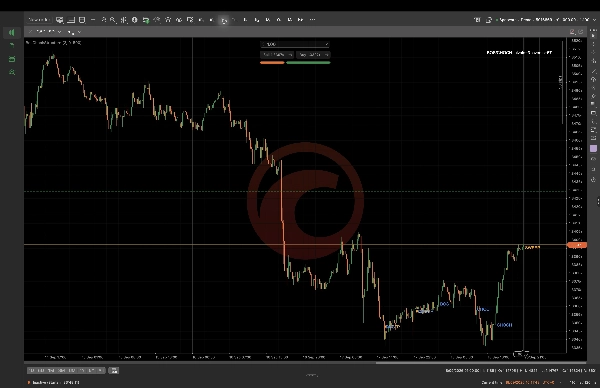
Trading product for BOS CHOCH Structure Indicador Key Levels MSS, image 2
Trading product for BOS CHOCH Structure Indicador Key Levels MSS, image 3
Trading product for BOS CHOCH Structure Indicador Key Levels MSS, image 4
Trading product for BOS CHOCH Structure Indicador Key Levels MSS, image 5
Trading product for BOS CHOCH Structure Indicador Key Levels MSS, image 6
Trading product for BOS CHOCH Structure Indicador Key Levels MSS, image 7
Trading product for BOS CHOCH Structure Indicador Key Levels MSS, image 8
Trading product for BOS CHOCH Structure Indicador Key Levels MSS, image 9
Desde 16/09/2026

Descrição

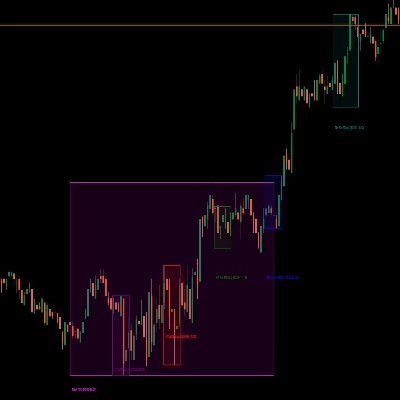
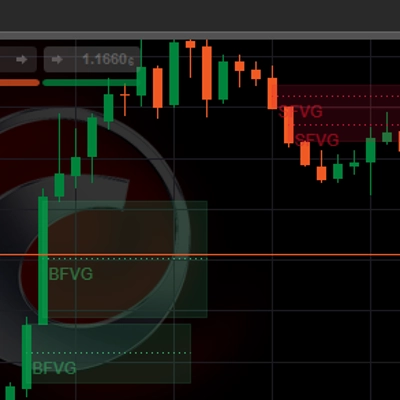
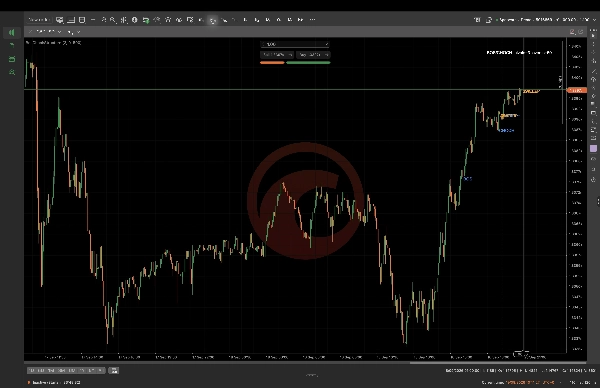
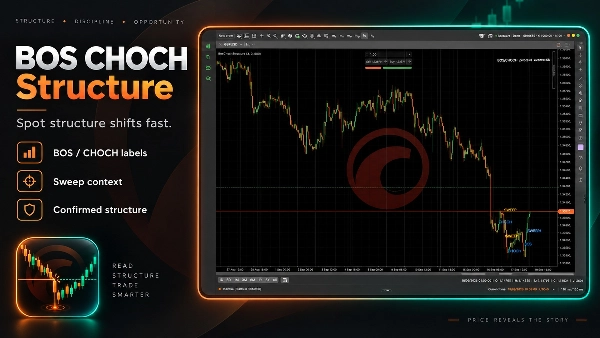
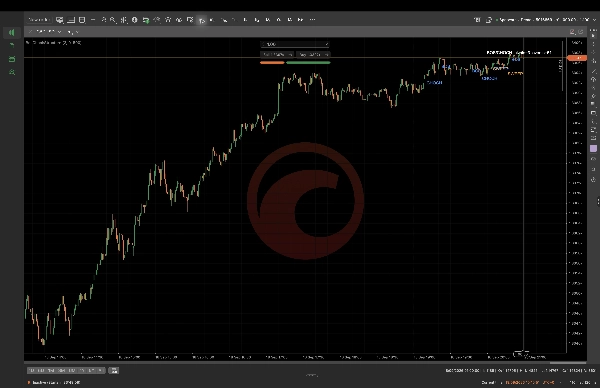
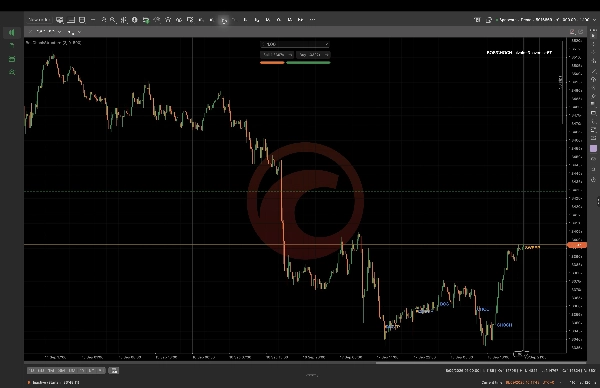
A estrutura BOS CHOCH é um indicador cTrader para leitura da estrutura de mercado confirmada em gráficos de preços. Ele analisa barras OHLC e pivôs confirmados, depois marca eventos de Quebra de Estrutura (BOS), Mudança de Característica (CHOCH) e varredura de pavio como anotações visuais no gráfico. Use a força do pivô, o buffer de quebra e a profundidade do histórico para ajustar a visualização para seus instrumentos e períodos preferidos. Destina-se à análise discricionária de gráficos nos mercados forex e de índices, incluindo revisão intradiária e em prazos maiores. As etiquetas são auxiliares de confirmação, não previsões ou execução automática de negociações. Os sinais dependem dos dados de barras concluídas e dos parâmetros selecionados; este indicador não realiza ordens nem garante resultados.

Resumo

Resumo de IA
BOS CHOCH Structure is a cTrader indicator designed to identify and display confirmed market structure events directly on price charts. It analyzes OHLC bars and confirmed pivot points to visually mark Break of Structure (BOS), Change of Character (CHOCH), and wick Sweep events as on-chart annotations. Users can adjust parameters such as pivot strength, break buffer, and history depth to customize the indicator’s sensitivity for various instruments and timeframes. The tool supports discretionary analysis primarily for forex and index markets, suitable for both intraday and higher timeframe reviews. It provides confirmation aids based on completed-bar data but does not generate predictive signals or execute trades automatically. This indicator focuses on visualizing key market structure shifts and liquidity grabs to assist traders in their chart analysis.
Perfil do indicador
Categoria do indicador
Estrutura do mercado (SMC)
Tipo de resultado
Visualização
Requisitos de dados
Apenas barras
Sinais suportados
Quebra
Inversão

Conversa

Avaliações de clientes

4.5
Avaliações: 4
5
50 %
4
50 %
3
0 %
2
0 %
1
0 %
Avaliações de clientes
October 26, 2026
Confirmed pivots, completed candles and an adjustable break buffer give the BOS, CHoCH and wick sweep labels a clear, inspectable basis rather than an undefined notion of market structure.
October 20, 2026
Wick sweeps beside confirmed structure give the chart some welcome nuance. Pivot strength and the break buffer define what is significant. The overlay has clear rules to inspect rather than another unexplained claim to know the next break.
October 14, 2026
The break buffer and pivot strength let the meaning of structure be adjusted openly. BOS and CHoCH follow completed candles and confirmed pivots. That makes the markings fairly transparent instead of hiding their sensitivity behind a label.
October 12, 2026
Confirmed pivots and completed bars give the BOS and CHoCH labels a reasonably clear foundation. Pivot strength and the break buffer expose sensitivity, with wick sweeps recorded as structural events rather than forecasts of the next move.

Perguntas frequentes

Key Levels
MSS
BOS
CHOCH
Market Structure
Liquidity Grab
Os produtos disponíveis através da cTrader Store, incluindo bots de negociação, indicadores e plugins, são fornecidos por programadores terceiros e são disponibilizados apenas para fins informativos e de acesso técnico. A cTrader Store não é um corretor e não fornece aconselhamento em matéria de investimento, recomendações pessoais ou qualquer garantia de desempenho no futuro.

Mais deste autor

Indicador
BOS
Add standard-timeframe context candles to a native Renko chart.
Indicador
EMA
Volume
Map range high, mid, low, price location and a deterministic pressure proxy on your cTrader chart.
Indicador
Channel
Key Levels
+1
Monitor a selected chart trendline and confirm breaks on candle close.
Plugin para desktop
Trade Journal
Trade Statistics
Review daily PnL, trade counts, losing streaks and rapid re-entry from your cTrader history.
Plugin para desktop
Chart UI Tools
Keep lines, zones and channels synced across selected same-symbol charts from one desktop plugin.
cBot
Drawdown Guard
Daily Loss Limit
Monitor account-wide loss and stop-loss risk budgets, with optional order cancellation and post-fill closure.
Plugin para desktop
Position Sizer
Risk Calculator
Size manual trades from your risk settings and review Market, Limit or Stop orders before execution.
Indicador
Volume
Key Levels
View tick activity across a selected chart range with Point of Control, Value Area High and Value Area Low.

Também poderá gostar de

Indicador
The Multi-Timeframe Candle Indicator displays candles from multiple timeframes in one window, enhancing market analysis!
Indicador
AI
SMC
+14
Refined cleaner version of Key Levels indicator with broker UTC offset, styles & label alignment.
Logótipo de "KANDIKA HEAT MAP"
Bem avaliado
4.6
(5)
$19
Indicador
Color-Based Market Pressure & Volatility Visualizer The Kandika Heatmap Indicator
Indicador
AI
ATR
+19
Market Cipher A
Indicador
AI
ATR
+27
Support and Resistance with signals
Indicador
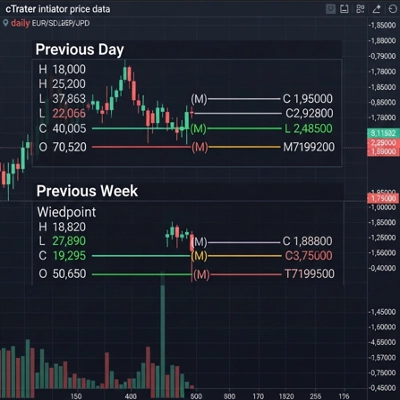
The Weekly Daily Levels indicator shows the OHLC, and mid-point prices for the previous day and week.
Indicador
ATR
RSI
+20
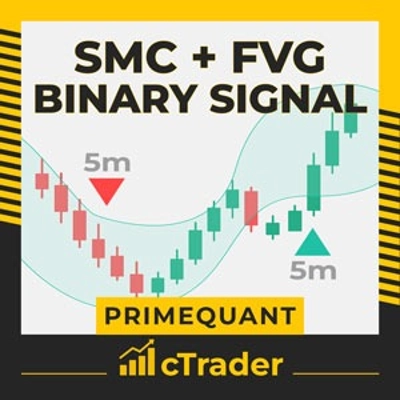
SMC/ICT signals using FVG + liquidity sweep/MSS with EMA-RSI-MACD filters, clear visuals, and actionable alerts.
Indicador
Volume
Key Levels
+1
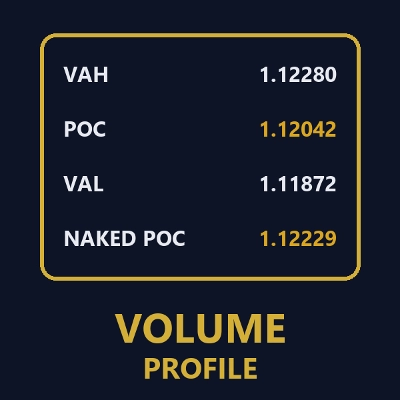
Session volume profiles from tick volume: POC, value area high and low, and naked POCs extended until touched.
Indicador
RSI
SMC
+17
RSI, MACD, Stochastic, CCI & Momentum divergence scanner with confluence scoring. Never miss a signal again!
Indicador
AI
ATR
+23
The ZigZag Trend is a market structure tool that filters out small price fluctuations and highlights major swing.
Indicador
SMC
Prop
+8
KILLZONES AND MACRO SESSIONS
Indicador
Volume
Order Block
+4
Advanced Pro Volume Profile: Double Back-to-Back, Institutional Dynamic, Fixed Range & Order Flow
Indicador
Doji
Wedge
+5
Angora Pattern Recognition is a cTrader indicator that finds, draws and tracks classic chart patterns automatically.
Indicador
Supertrend
Moving Average
Easy Trade: Trend & Breakout Indicator for cTrader
Indicador
Risk Dashboard
AI-powered daily range forecasts help traders spot volatility opportunities and plan stops and targets.
Indicador
ATR
BOS
+5
Market structure with BOS and CHoCH, order blocks, and retest buy/sell arrows with entry, stop and two targets
Indicador
ATR
RSI
+11
This indicator puts three helpful trading tools on your chart at once. Think of it like having three expert traders
Indicador
BOS
Imbalance
+4
Automatically detects and highlights both Bullish and Bearish Fair Value Gaps (FVGs).

Preço

Desde 16/09/2026