Opis
PEŁNY OPIS
Profil Wolumenu Odrzucenia Ceny Battlezone
Wskaźnik Profilu Odrzucenia cTrader — Gęstość Odrzucenia Knotów, Wykrywanie Odwrócenia Następnego Słupka i Wielopoziomowe Strefy Ciepła z Poziomami POC
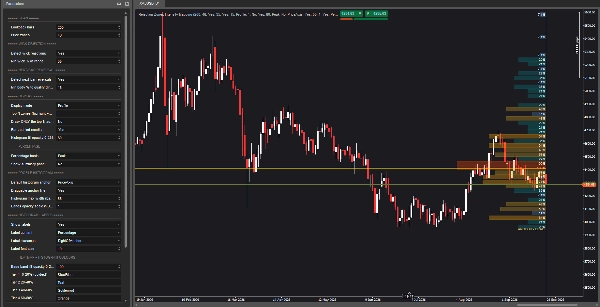
Profil Wolumenu Odrzucenia Ceny Battlezone to wskaźnik cTrader, który buduje profil odrzucenia ceny zamiast surowego wolumenu. Przeszukuje historyczne słupki pod kątem odrzucenia knotów i odwróceń następnego słupka, grupuje je w strefy cenowe i wyświetla wielopoziomową mapę ciepła z poziomami POC — wszystko osadzone na w pełni przesuwalnej linii profilu.
Zamiast pokazywać, gdzie handlowano największym wolumenem, pokazuje, gdzie cena wielokrotnie walczyła i poniosła porażkę — warstwa strukturalna uzupełniająca profil wolumenu, profil rynku i tradycyjną analizę wsparcia/oporu.
Natywny cTrader • Brak przemalowywania na zamkniętych słupkach • Przesuwalny kotwica i granica zakresu • Pięciopoziomowa mapa ciepła
Co robi wskaźnik
Profil Wolumenu Odrzucenia Ceny Battlezone odpowiada na jedno podstawowe pytanie:
Gdzie cena była wielokrotnie odrzucana — i jak intensywne jest to odrzucenie w porównaniu z innymi strefami?
Wskaźnik skanuje konfigurowalne okno wstecz (lookback) w poszukiwaniu dwóch zdarzeń odrzucenia:
- Odrzucenia knotów — świece, gdzie górny lub dolny knot przekracza konfigurowalny procent zakresu świecy, wskazując, że cena została odsunięta od poziomu
- Odwrócenia następnego słupka — świeca kierunkowa natychmiast po niej następuje świeca w przeciwnym kierunku, z minimalnym rozmiarem korpusu kwalifikującym
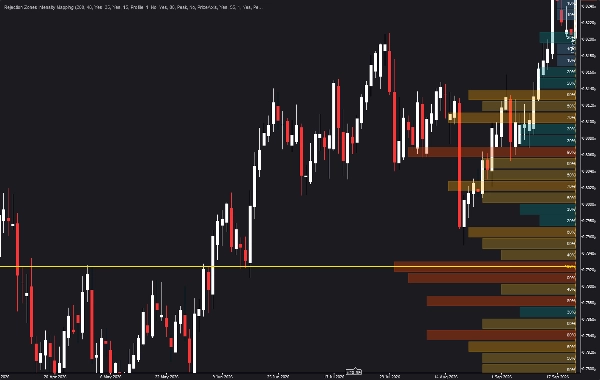
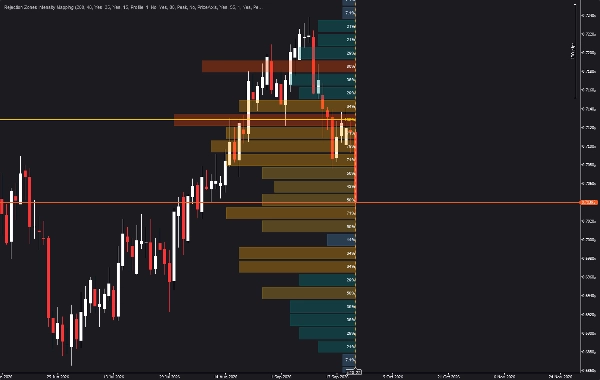
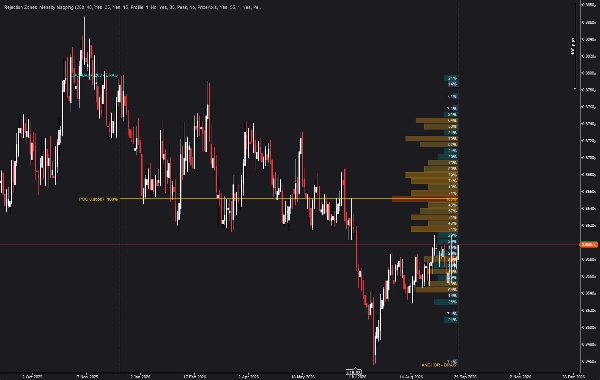
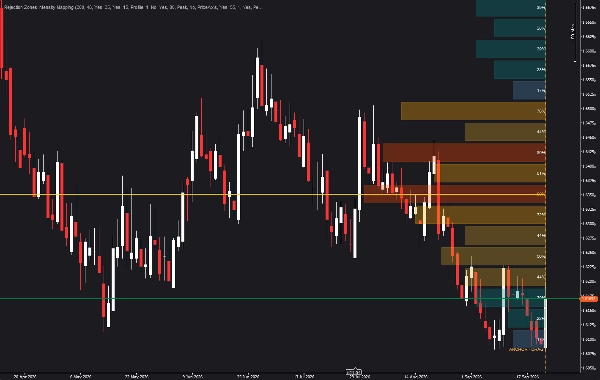
Każde zdarzenie jest grupowane w strefę cenową. Intensywność strefy jest obliczana, klasyfikowana i wyświetlana jako wielopoziomowy histogram. Najsilniejsze strefy oznaczone są poziomami POC (Point of Control) rozciągającymi się na prawo od wykresu.
Główne komponenty
Silnik skanowania odrzucenia
Skanuje ostatnie N słupków (konfigurowalny lookback, domyślnie 200). Wykrywa odrzucenia knotów i odwrócenia następnego słupka niezależnie — każdy można włączać lub wyłączać.
Wykrywanie odrzucenia knota
Słupek kwalifikuje się jako odrzucenie knota, gdy jego górny lub dolny knot przekracza skonfigurowany minimalny procent zakresu (domyślnie: 35%). Każdy kwalifikujący się knot jest przypisywany do strefy cenowej zawierającej koniec knota.
Wykrywanie odwrócenia następnego słupka
Słupek kwalifikuje się, gdy następny słupek zamyka się w przeciwnym kierunku z rozmiarem korpusu równym lub większym od minimalnego procentu korpusu (domyślnie: 15%). Cena kotwicy dla odwrócenia może być ustawiona na zamknięcie, ekstremum słupka odwracającego lub ekstremum struktury dwusłupkowej (domyślne i zalecane).
Grupowanie stref cenowych
Skanowany zakres cenowy jest dzielony na konfigurowalną liczbę stref (domyślnie: 48, maksymalnie: 60). Każde zdarzenie odrzucenia jest przypisywane do odpowiedniej strefy.
Pięciopoziomowa mapa ciepła
Strefy są klasyfikowane do pięciu poziomów intensywności na podstawie liczby odrzucenia względem szczytu:
- Poziom 1 — 0–20% (najzimniejszy) — domyślnie: SteelBlue
- Poziom 2 — 20–40% — domyślnie: Teal
- Poziom 3 — 40–60% — domyślnie: Goldenrod
- Poziom 4 — 60–80% — domyślnie: Orange
- Poziom 5 — 80–100% (najgorętszy) — domyślnie: OrangeRed
Każdy poziom ma swój konfigurowalny kolor.
Poziomy POC
Najlepsze N stref oznaczone są poziomymi liniami POC rozciągającymi się na prawo. Najgorętsza strefa oznaczona jest jako "POC", pozostałe jako "P2", "P3" itd. Etykiety opcjonalnie zawierają procentową intensywność strefy.
Tryby wyświetlania
Trzy tryby wyświetlania:
- Profil — słupki histogramu rozciągające się w lewo od kotwicy
- Pasma — pełnej szerokości pasma ciepła na całym zakresie
- Oba — profil z delikatną warstwą tła pasma
Przesuwalna linia kotwicy
Kotwica profilu jest w pełni przesuwalna. Przesuń ją, aby zmienić pozycję całego histogramu. Domyślna pozycja to oś cenowa lub tuż za ostatnią świecą — konfigurowalne.
Przesuwalna granica lookback
Druga przesuwalna linia (domyślnie teal) oznacza lewą krawędź okna lookback. Przesuń ją, aby uwzględnić więcej lub mniej słupków.
Podstawa procentowa
Trzy opcje:
- Szczyt — procent najgorętszej strefy (domyślnie: najgorętsza = 100%)
- Słupki — procent słupków lookback (absolutna presja)
- Zdarzenia — udział w dystrybucji wszystkich trafień
Opcjonalny panel podsumowania
Po włączeniu wyświetla Top 3 strefy z ich zakresami cen, procentami i liczbą trafień (podział na knot i odwrócenie).
Jak to działa
- Skanowane jest ostatnie N słupków (konfigurowalny lookback, domyślnie 200).
- Każdy słupek jest oceniany pod kątem:
-
- Odrzucenia knota: górny lub dolny knot ≥ minimalny % knota zakresu
- Odwrócenia następnego słupka: korpus kierunkowy, po którym następuje korpus w przeciwnym kierunku spełniający minimalny % korpusu
- Kwalifikujące się zdarzenia są przypisywane do stref cenowych. Skanowany zakres cenowy jest równomiernie dzielony na N stref.
- Intensywność strefy jest obliczana jako liczba zdarzeń odrzucenia w każdej strefie, znormalizowana zgodnie z wybraną podstawą procentową.
- Strefy są klasyfikowane według intensywności. Najlepsze N stref oznaczone są jako poziomy POC.
- Każda strefa jest wyświetlana jako poziomy słupek histogramu, proporcjonalny do intensywności, kolorowany według poziomu, z opcjonalną etykietą procentową.
- Linie POC rozciągają się od lewej krawędzi okna lookback do prawej strony kotwicy.
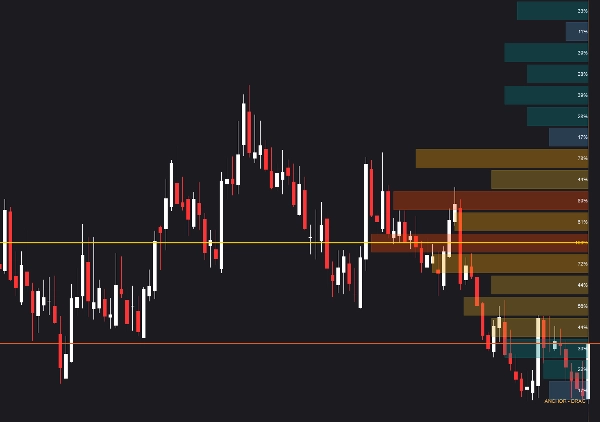
Co widzisz na wykresie
- Poziomy histogram rozciągający się w lewo od przesuwalnej linii kotwicy
- Słupki stref proporcjonalne do intensywności odrzucenia
- Pięć kolorowanych poziomów intensywności (SteelBlue → Teal → Goldenrod → Orange → OrangeRed)
- Linie POC rozciągające się na prawo od wykresu, z etykietami
- Opcjonalne etykiety procentowe na każdej strefie
- Przesuwalna bursztynowa linia kotwicy (oznaczona "ANCHOR – DRAG")
- Przesuwalna tealowa linia granicy lookback (oznaczona "LOOKBACK – DRAG")
- Opcjonalna delikatna obwiednia zakresu z etykietami HI/LO
- Opcjonalny panel podsumowania pokazujący Top 3 strefy
Zachowanie historyczne i bez przemalowywania
Całe skanowanie odrzucenia i obliczenia intensywności stref opierają się na zamkniętych słupkach. Historyczne kolory stref, intensywności i poziomy POC nie zmieniają się po zamknięciu słupków, od których zależą.
Aktualnie formujący się słupek nie jest liczony do intensywności odrzucenia. Jego knot może ostatecznie kwalifikować się jako odrzucenie, ale dopiero po zamknięciu. W efekcie profil jest stabilny do momentu zamknięcia następnego słupka, kiedy to profil aktualizuje się raz z nowo potwierdzonymi danymi o odrzuceniu.
Architektura parametrów
Skanowanie
Słupki lookback (domyślnie: 200) · Strefy cenowe (domyślnie: 48, max: 60)
Odrzucenie knota
Wykrywanie odrzucenia knota (Tak / Nie) · Min % knota zakresu (domyślnie: 35)
Odwrócenie następnego słupka
Wykrywanie odwrócenia następnego słupka (Tak / Nie) · Min % korpusu do kwalifikacji kierunku (domyślnie: 15)
Wyświetlanie
Tryb wyświetlania (Profil / Pasma / Oba) · Top N stref do wyróżnienia · Rysuj TYLKO Top N stref (Tak / Nie) · Słupki za świecami (Tak / Nie) · Krycie wypełnienia histogramu (0–255)
Procent
Podstawa procentowa (Szczyt / Słupki / Zdarzenia) · Pokaż panel podsumowania (Tak / Nie)
Histogram profilu
Domyślna kotwica histogramu (PriceAxis / LastBar) · Przesuwalna linia kotwicy (Tak / Nie) · Maksymalna szerokość histogramu w słupkach · Skala krycia pasm w trybie OBA
Etykiety histogramu
Pokaż etykiety (Tak / Nie) · Zawartość etykiety (Procent / Trafienia / Oba) · Umiejscowienie etykiety (InsideBarCentered / RightOfAnchor / LeftOfBar) · Rozmiar czcionki etykiety
Kolory mapy ciepła + histogramu
Podstawowa krycie wypełnienia pasma 0–255 · Kolor poziomu 1 · Kolor poziomu 2 · Kolor poziomu 3 · Kolor poziomu 4 · Kolor poziomu 5
Przesuwalny lookback
Przesuwalna granica lookback (Tak / Nie)
Poziomy POC
Linie POC na Top-N strefach (Tak / Nie)
Obwiednia zakresu
Delikatna obwiednia zakresu (Tak / Nie)
Praktyczne scenariusze rynkowe
Znajdowanie najsilniejszego poziomu odrzucenia
Grupa stref poziomu 5 (OrangeRed) w pobliżu poprzedniego lokalnego maksimum ujawnia, gdzie cena była wielokrotnie odrzucana. Ten poziom staje się najwyższą linią POC — najsilniejszym poziomem odrzucenia w skanowanym oknie.
Rozróżnianie prawdziwych poziomów od słabych
Strefy poziomu 1 i 2 (SteelBlue, Teal) pojawiają się w obszarach, przez które cena przeszła swobodnie. Są to poziomy o niższej wiarygodności i można je depriorytetyzować w planowaniu transakcji.
Analiza specyficzna dla zakresu z przesuwalną kotwicą
Przeciągnij bursztynową kotwicę do ostatniego zakresu swing high–low. Profil jest odbudowywany dla tego zakresu, ujawniając strukturę odrzucenia specyficzną dla tego ruchu — nie całego lookback.
Dostosowywanie lookback za pomocą tealowej linii
Przeciągnij tealową granicę lookback dalej w lewo, aby uwzględnić więcej historii, lub dalej w prawo, aby skupić się na ostatniej akcji cenowej. Profil jest odbudowywany natychmiast.
Top N stref dla czystych wykresów
Włącz "Rysuj TYLKO Top N stref" i ustaw N na 3 lub 5. Rysowane są tylko najsilniejsze poziomy odrzucenia — idealne dla traderów, którzy chcą czystych wykresów bez utraty kluczowych informacji strukturalnych.
Konfluencja z profilem wolumenu
Nałóż profil odrzucenia obok tradycyjnego profilu wolumenu. Strefy, gdzie oba się pokrywają, są poziomami o najwyższej wiarygodności.
Kompatybilność
- Platforma: cTrader (API cAlgo)
- Klasy aktywów: Forex, metale w tym XAUUSD, indeksy w tym US30, NAS100 i GER40, towary i instrumenty kryptowalutowe
- Interwały czasowe: Wszystkie interwały (M1 do miesięcznego)
- Dane wolumenu: Nie wymagane — wykrywanie odrzucenia używa tylko akcji cenowej
- Zależności: Brak. Natywny cAlgo, bez zewnętrznych bibliotek
Uwagi techniczne
Wskaźnik jest napisany w całości w cAlgo (C#). Wykrywanie odrzucenia używa tylko akcji cenowej — nie są wymagane dane wolumenu, co czyni wskaźnik równie wiarygodnym na instrumentach z ograniczoną historią wolumenu (krypto, niektóre CFD, egzotyczne pary).
Strefy są rysowane jako obiekty prostokątne wykresu osadzone na przesuwalnej linii kotwicy, z długością słupka proporcjonalną do znormalizowanej intensywności odrzucenia. Kolorowanie stref podąża za skonfigurowaną pięciopoziomową mapą ciepła.
Zarówno linia kotwicy profilu, jak i linia granicy lookback są prawdziwymi obiektami wykresu cTrader — co oznacza, że przeciągasz je bezpośrednio na wykresie, a profil jest odbudowywany w odpowiedzi. Zdarzenia przewijania i powiększania utrzymują kotwicę poprawnie umiejscowioną przy osi cenowej w trybie "Podążaj za wykresem".
Linie POC rozciągają się od lewej krawędzi okna lookback do prawej strony kotwicy. Najwyższa strefa oznaczona jest "POC" (linia ciągła); strefy drugorzędne oznaczone są "P2", "P3" itd. (linie przerywane).
Opcjonalna obwiednia zakresu rysuje delikatny prostokąt wokół skanowanego zakresu cen z etykietami cen HI/LO.
Dla kogo jest ten wskaźnik?
Profil Wolumenu Odrzucenia Ceny Battlezone jest odpowiedni dla traderów, którzy chcą:
- Alternatywy opartej na odrzuceniu dla tradycyjnego profilu wolumenu
- Strukturalnego widoku miejsc, gdzie cena wielokrotnie zawiodła
- Wizualnej mapy ciepła intensywności odrzucenia wzdłuż ceny
- Przesuwalnych kotwic do analizy specyficznej dla zakresu
- Filtrowania Top N dla przejrzystości wykresów
- Poziomów POC wyprowadzonych z gęstości odrzucenia, a nie surowego wolumenu
Używaj go razem z szerszymi metodologiami obejmującymi akcję cenową, strukturę rynku, analizę wolumenu, badania odwrócenia do średniej lub kontynuacji trendu.
Wskaźnik zapewnia wizualizację analityczną — nie jest sygnałem kupna ani sprzedaży.
Zakup
Profil Wolumenu Odrzucenia Ceny Battlezone jest dostępny w sklepie cTrader. Twój zakup obejmuje dostęp dożywotni, personalizację pięciopoziomowej mapy ciepła, przesuwalne linie kotwicy i lookback oraz bezpośrednie wsparcie dewelopera.
Profil Wolumenu Odrzucenia Ceny Battlezone — Profil Odrzucenia cTrader | Profil Wolumenu Odrzucenia | Strefy Odrzucenia Knotów | Wykrywanie Odwrócenia Następnego Słupka | Mapa Ciepła Odrzucenia | Intensywność Stref Cenowych | Poziomy POC | Wskaźnik cTrader | Wskaźnik cAlgo | Strefy Bez Przemalowywania | Mapa Ciepła Wsparcia i Oporu | Przesuwalny Profil Kotwicy | Mapowanie Wielopoziomowe Stref | Wskaźnik XAUUSD | Wskaźnik US30 | Wskaźnik NAS100 | Wskaźnik Struktury Rynku | Gęstość Odrzucenia | Wskaźnik Battlezone
Podsumowanie
The indicator features a fully draggable anchor line and lookback boundary for range-specific analysis, allowing users to reposition the profile and adjust the historical window dynamically. The strongest rejection zones are marked with Point of Control (POC) levels extending horizontally on the chart. Display modes include histogram profiles, full-width heat bands, or both combined. An optional summary panel highlights the top rejection zones with detailed statistics.
Designed for use across all timeframes and various asset classes—including forex, metals, indices, commodities, and cryptocurrencies—this tool requires no volume data, relying solely on price action. It provides a structural layer complementary to volume profile and support/resistance analysis, aiding traders in identifying key price levels where price has repeatedly failed. The indicator is non-repainting and native to cTrader’s cAlgo API.
Opinie klientów
5 | 100 % | |
4 | 0 % | |
3 | 0 % | |
2 | 0 % | |
1 | 0 % |