
Descrição
Funcionamento do indicador UTBot (Italiano)
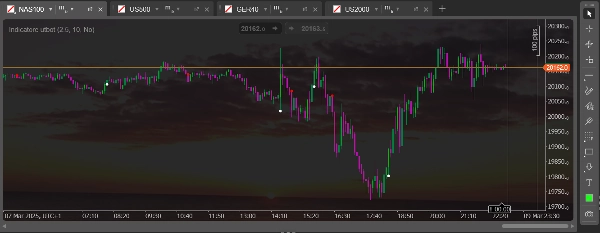
O indicador UTBot é uma ferramenta de análise técnica que cria uma linha de trailing stop dinâmica baseada no ATR. Calcula um valor de stop usando o ATR multiplicado por um fator de sensibilidade, criando assim um suporte/resistência que se adapta à volatilidade. Identifica tendências de alta quando o preço permanece acima dessa linha e de baixa quando fica abaixo. Gera sinais de compra quando o preço cruza a linha de baixo para cima e sinais de venda quando cruza de cima para baixo. Um cruzamento da EMA com a linha de trailing stop é frequentemente usado como confirmação. É eficaz em mercados direcionais e na gestão de stops dinâmicos para posições abertas.
UTBot Indicator Functionality (English)
The UTBot indicator is a technical analysis tool that creates a dynamic trailing stop line based on ATR. It calculates a stop value using ATR multiplied by a sensitivity factor, creating support/resistance that adapts to volatility. It identifies uptrends when price stays above this line and downtrends when below. It generates buy signals when price crosses above the line from below and sell signals when crossing below from above. An EMA crossover with the trailing stop line is often used as confirmation. It's effective in directional markets and for managing dynamic stops for open positions.
Resumo
Avaliações de clientes
5 | 100 % | |
4 | 0 % | |
3 | 0 % | |
2 | 0 % | |
1 | 0 % |


