
Descrição
Níveis de Números Redondos - Indicador para cTrader
Descrição
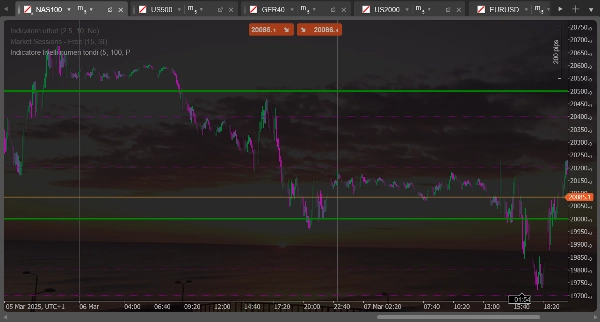
Este indicador desenha linhas horizontais em "números redondos" ou níveis psicologicamente significativos no gráfico. É ideal para identificar potenciais áreas de suporte e resistência baseadas em níveis de preço redondos que frequentemente têm importância psicológica para os traders.
Principais Funções
- Desenha dois conjuntos distintos de linhas horizontais em intervalos regulares
- Calcula automaticamente os níveis com base no preço de fechamento atual
- Atualiza dinamicamente conforme o preço se move
- Oferece configuração separada para cada conjunto de linhas (cor, estilo, tamanho)
Ajustes Possíveis
Para o primeiro conjunto de linhas (tracejado)
- Número de Linhas Conjunto 1: Determina quantas linhas desenhar acima e abaixo do preço atual (padrão: 5)
- Tamanho do Intervalo Conjunto 1: Define a distância entre as linhas em pips (padrão: 100 pips)
- Cor das Linhas Conjunto 1: Personaliza a cor das linhas (padrão: roxo)
- Espessura das Linhas Conjunto 1: Define a espessura das linhas (padrão: 1 pixel)
Para o segundo conjunto de linhas (contínuo)
- Número de Linhas Conjunto 2: Determina quantas linhas desenhar acima e abaixo do preço atual (padrão: 2)
- Tamanho do Intervalo Conjunto 2: Define a distância entre as linhas em pips (padrão: 500 pips)
- Cor das Linhas Conjunto 2: Personaliza a cor das linhas (padrão: verde)
- Espessura das Linhas Conjunto 2: Define a espessura das linhas (padrão: 1 pixel)
Uso Prático
Tipicamente, o primeiro conjunto (linhas tracejadas) é usado para identificar níveis psicológicos menores, enquanto o segundo conjunto (linhas contínuas) destaca níveis psicológicos maiores. Por exemplo, para EURUSD, você pode configurar o primeiro conjunto para mostrar níveis a cada 100 pips (como 1.0800, 1.0900) e o segundo conjunto para níveis a cada 500 pips (como 1.0500, 1.1000).
Esses níveis frequentemente coincidem com zonas de suporte ou resistência onde o preço pode saltar ou desacelerar antes de continuar seu movimento.
Round Number Levels - Indicator for cTrader
Description
This indicator draws horizontal lines at "round numbers" or psychologically significant levels on the chart. It's ideal for identifying potential support and resistance areas based on round price levels that often have psychological importance for traders.
Main Features
- Draws two distinct sets of horizontal lines at regular intervals
- Automatically calculates levels based on the current closing price
- Updates dynamically as price moves
- Offers separate configuration for each set of lines (color, style, size)
Possible Adjustments
For the first set of lines (dashed)
- Number of Lines Set 1: Determines how many lines to draw above and below the current price (default: 5)
- Range Size Set 1: Sets the distance between lines in pips (default: 100 pips)
- Line Color Set 1: Customizes the color of the lines (default: purple)
- Line Width Set 1: Sets the thickness of the lines (default: 1 pixel)
For the second set of lines (solid)
- Number of Lines Set 2: Determines how many lines to draw above and below the current price (default: 2)
- Range Size Set 2: Sets the distance between lines in pips (default: 500 pips)
- Line Color Set 2: Customizes the color of the lines (default: green)
- Line Width Set 2: Sets the thickness of the lines (default: 1 pixel)
Practical Usage
Typically, the first set (dashed lines) is used to identify minor psychological levels, while the second set (solid lines) highlights major psychological levels. For example, for EURUSD, you might set the first set to show levels every 100 pips (such as 1.0800, 1.0900) and the second set for levels every 500 pips (such as 1.0500, 1.1000).
These levels often coincide with support or resistance zones where price might bounce or slow down before continuing its movement.
Resumo
Avaliações de clientes
5 | 50 % | |
4 | 50 % | |
3 | 0 % | |
2 | 0 % | |
1 | 0 % |


