Descrição
✔ Site para inserir dados, acesse a aba indicadores: https://tradingeconomics.com/
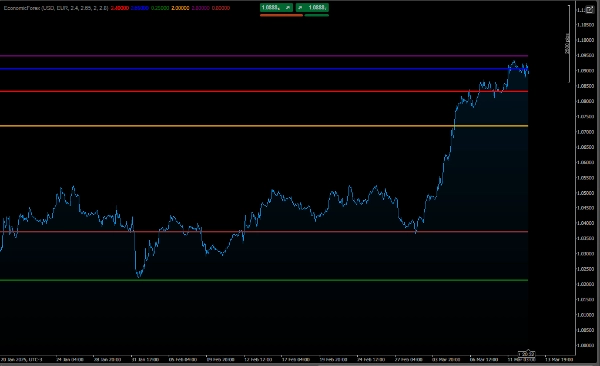
Como Interpretar o Gráfico
Diferença entre Taxas de Juros Nominais e Reais:
A taxa de juros nominal é o valor bruto da taxa de juros.
A taxa de juros real leva em conta a inflação, mostrando o poder de compra real do dinheiro.
Se a inflação for maior que a taxa de juros nominal, a taxa de juros real será negativa, indicando perda do poder de compra.
Comparação de Moedas:
O gráfico permite comparar as condições econômicas das duas moedas.
Por exemplo, se a taxa de juros real da moeda principal for maior que a da moeda contraparte, isso pode indicar que a moeda principal é mais atraente para investimento.
Evolução ao Longo do Tempo:
As linhas mostram como a inflação, a taxa de juros nominal e a taxa de juros real mudam ao longo do tempo, permitindo identificar tendências.
Exemplo de Uso
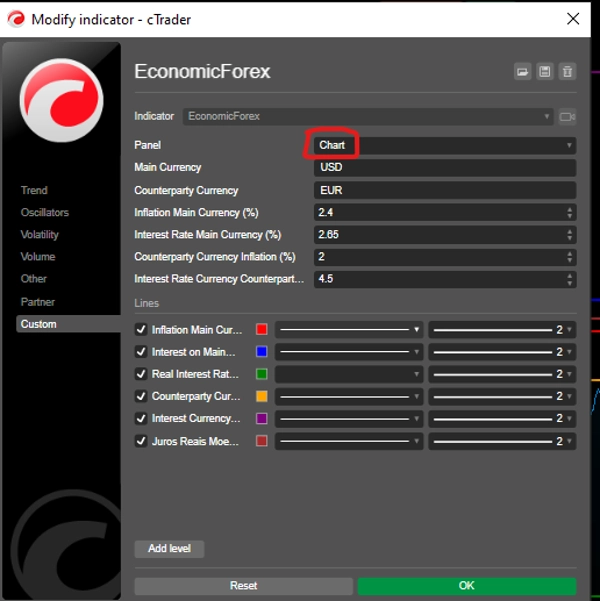
Suponha que você defina os parâmetros da seguinte forma:
Moeda Principal: USD (Dólar Americano)
Inflação: 5%
Taxa de Juros Nominal: 6,5%
Moeda Contraparte: EUR (Euro)
Inflação: 2%
Taxa de Juros Nominal: 4%
O gráfico mostrará:
USD:
Juros Reais: 1,5% (6,5% - 5%)
EUR:
Juros Reais: 2% (4% - 2%)
Com isso, você pode comparar as condições econômicas do USD e do EUR e tomar decisões informadas no mercado forex.
Conclusão
Este código é uma ferramenta útil para traders e analistas que desejam monitorar e comparar indicadores econômicos de duas moedas em um par forex. Ele fornece insights sobre inflação, taxas de juros nominais e taxas de juros reais, ajudando a entender o cenário macroeconômico e suas implicações para o mercado forex.
veja este algoritmo de baixo risco:👇🏻
https://ctrader.com/pt/products/601?u=carneiroads
https://ctrader.com/pt/products/623?u=carneiroads
Resumo
The indicator distinguishes between nominal interest rates (the gross interest rate) and real interest rates (adjusted for inflation), highlighting the purchasing power of money. It allows comparison of economic conditions between a main currency and a counterparty currency by plotting their respective inflation, nominal, and real interest rates over time. This helps identify trends and relative investment attractiveness; for example, a higher real interest rate in the main currency compared to the counterpart may indicate greater investment appeal.
Users input data such as inflation and nominal interest rates for each currency, which can be sourced from economic data websites like TradingEconomics.com. The tool supports informed decision-making in the forex market by providing a clear view of evolving economic factors affecting currency pairs.