
Descrição
▁▂▃▄▅▆▇ █ 10.000+ traders (institucionais + varejo) █ ▇▆▅▄▃▂▁
- Escolha nossos principais indicadores no cTrader 🏆
- ✨ Precisão exclusiva para resultados superiores ✨
- 📈 Nossos algoritmos — com os visuais mais bem avaliados 🎯—
- foram implementados com sucesso em 2 fundos quantitativos
▁▂▃▄▅▆▇ █████████████████████████████ ▇▆▅▄▃▂▁
_______________________________________________
_______________________________________________
📌 Indicadores de Estrutura de Mercado
· ✅ AdvancedMarket Structure: Bos, Choch, SwinLevels, Order Blocks, Market Structure& Liquidity Finder
· 🔄 Análise Dinâmica da Estrutura de Mercado dos Pontos de Reversão
· 🧱 Order Block
· ⛓️ BOS & CHOCH
· 🧠 ICT Power of 3
______________________________________________________________-
Loja cBots : 🧠 Gold & BTC BreakoutSession Pivots 🧠
_______________________________________________
🔚 Sistemas Inteligentes de Saída
· 📍 Algoritmo Inteligente de Trailing
_______________________________________________
📐 Indicadores ZigZag
· 🔍 Projeção de Liquidez de Preço ZigZag
· ➖ ZigZag
· 🎯 Rastreador de Extremos Zig-Zag
_______________________________________________
🧱 Indicadores de Suporte & Resistência
· 🟩 Linhas de Suporte & Resistência SmartTrend
· 🧱 Todos os Níveis de Suporte e Resistência
_______________________________________________
📊 Indicadores de Tendência & Canal
· 🔄 Canal de Tendência Automático
· 📊 Supertrend
· ⚡Analisador de Tendência Momentum
· 🧠 Canal de Tendência Adaptativo
· 💥 Sistema de Rompimento de Canal
· 🌈 Gradiente de Tendência Dinâmico
_______________________________________________
💧 Ferramentas de Volume & Liquidez
· 📉 Mapa de Liquidação de Alavancagem
· 🔍 Lacuna de Valor Justo Momentum
· 🕒 Sessões de Lacuna de Valor Justo
_______________________________________________
⚡ Indicadores de Momentum & RSI
· 🚀 Momentum de Alcance Dinâmico
· 🔎 Rastreador de Viés de Vela Multi-Nível
_______________________________________________
🔮 Ferramentas de Previsão & Projeção
· 📐 Previsão Baseada em Linreg & ATR
· 📏 Regressão Linear Fibonacci Multi-temporal
· 📈 Projetor de Fluxo de Mercado Alimentado por Volume
______________________________________________________________________________________________________
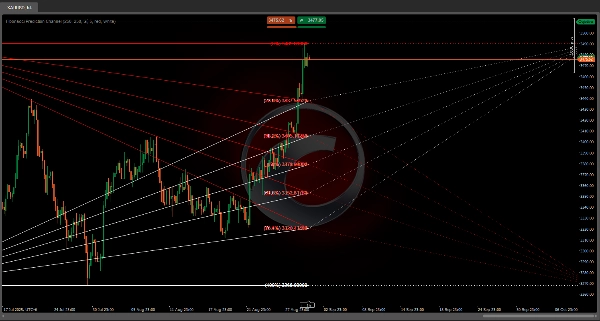
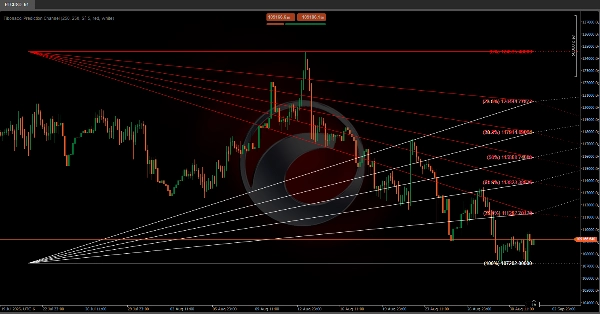
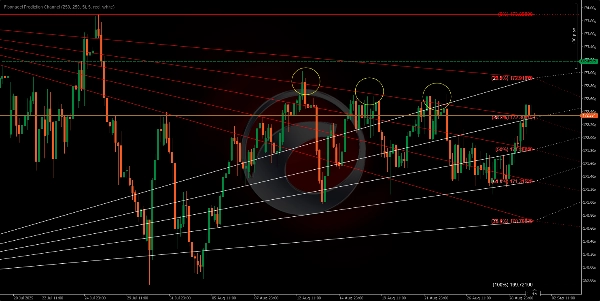
Este algoritmo é projetado para traçar um canal de previsão futura baseado nos níveis de Fibonacci de retração 📊✨. As linhas de Fibonacci criam uma série de canais paralelos entre cada par de níveis consecutivos. Esses canais podem ser interpretados como faixas dentro das quais o preço deve oscilar 📈📉, gerando um cone visual onde o preço irá interagir 🎯. Se um nível for rompido ⚡, passaremos para o próximo.
Esses níveis, que projetamos para o futuro, também atuam como suporte e resistência 🛡️⚔️, criando canais visuais no gráfico que podem nos ajudar a antecipar e planejar ações 🧠✅ com base em como o preço reagiu a esses níveis no passado.
Podemos esperar que o preço reaja ao se aproximar dessas linhas 🔍, potencialmente rebatendo dentro do canal 🔄 ou, se houver momentum 🚀 suficiente, rompendo as linhas para avançar para o próximo canal.
Os níveis projetados para a direita ➡️🗓️ não são baseados em novos dados de preço, mas na ação de preço passada ⏳. Eles se estendem para o futuro como uma espécie de "mapa" 🗺️ para potenciais reações futuras do preço.
Barras Históricas ⏰: Determina quantos períodos de preço passados serão considerados ao calcular os níveis de retração de Fibonacci.


