NNFX TP AND SL V1.1
Индикатор
Версия 1.0, Apr 2025
Windows, Mac
5.0
Отзывы: 1

Описание
🔹 Что это делает
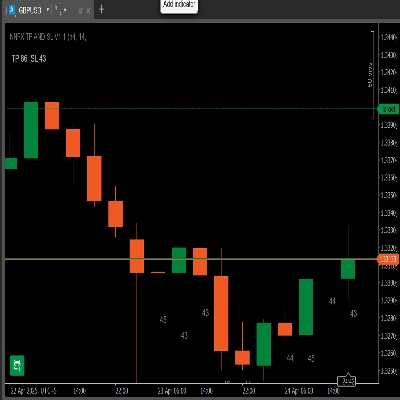
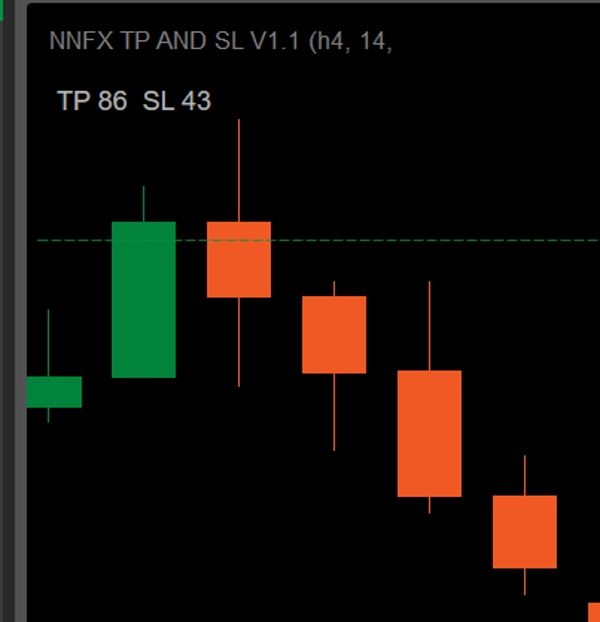
- Динамическая панель: Показывает “TP × SL” в пипсах на основе выбранного вами периода ATR и множителя TP.
- Метки ATR за последние 10 баров: Отображает ATR в пипсах под каждым из последних 10 свечей (на том же таймфрейме).
- Проверка таймфрейма: Если вы применяете его на другом таймфрейме графика, появляется предупреждение “Таймфреймы не совпадают – ATR не отображается на барах.”
🔹 Ключевые особенности
- Отображение панели
-
- TP = ATR × ваш множитель (выбирайте от 1 до 4.5 с шагом 0.5)
- SL = ATR в пипсах
- Пример: ATR = 43 → SL = 43 пипса. Если множитель = 2 → TP = 86 пипсов.
- Метки ATR по барам
-
- Отображает последние 10 баров с их значениями ATR в пипсах.
- Позволяет мгновенно отслеживать текущую волатильность.
- Проверка таймфрейма
-
- Метки отображаются только если таймфрейм графика совпадает с настройкой таймфрейма ATR.
- В противном случае внизу появляется красное предупреждение.
- Фильтрация всплесков (опционально)
-
- Включите фильтр среднее + k·σ для ограничения всплесков на барах.
- Настраиваемый множитель σ.
🔹 Как установить и использовать
- Скачать
NNFXATRInfoIndicator_v1.1.algo. - В cTrader → Algo → Indicators нажмите Import Indicator и выберите файл
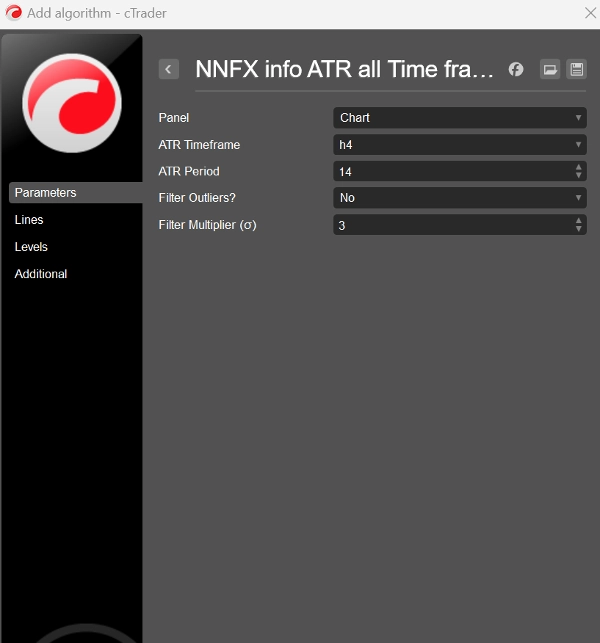
.algo. - Добавьте на график и откройте вкладку Параметры:
-
- Таймфрейм ATR: например, H4
- Период ATR: по умолчанию 14
- Множитель TP: 1 – 4.5
- Использовать фильтр всплесков?: Да/Нет
- Множитель фильтра σ: по умолчанию 3
- Нажмите Добавить на график. Вы увидите панель “TP × SL” в левом верхнем углу и метки ATR за последние 10 баров появятся автоматически (если таймфреймы совпадают).
🔹 Почему вам это понравится
- Никакой математики: Больше не нужно конвертировать десятичные значения в пипсы — всё в целых пипсах.
- Готово для NNFX: SL и TP точно соответствуют правилам ATR вашей системы. Вам нужно только выбрать таймфрейм и направление сделки — затем просто настройте множитель TP под желаемое соотношение риск/прибыль.
- Чисто и понятно: Вся информация о волатильности в одном компактном оверлее — без лишних панелей.
- Сверхгибко: Любая валютная пара, любой таймфрейм, полностью настраиваемо.
- ускорьте свои входы по NNFX с точными стопами и целями на основе ATR!
Сводка
Профиль индикатора
Отзывы покупателей
5.0
Отзывы: 1
5 | 100 % | |
4 | 0 % | |
3 | 0 % | |
2 | 0 % | |
1 | 0 % |
Отзывы покупателей
May 3, 2025
the first test should keep DD under 3 percent, and the trade idea gets a pause before execution.
Обсуждение
Частые вопросы
ATR
Продукты, доступные в cTrader Store, включая торговых ботов, индикаторы и плагины, предоставляются сторонними разработчиками и доступны исключительно в информационных и технических целях. cTrader Store не является брокером и не предоставляет инвестиционные консультации, персональные рекомендации или какие-либо гарантии будущей доходности.


Цена
С 24/04/2025
27.69M
Торгуемый объем
629.04K
Выигранные пипы