
Descrição
Este Indicador de Gráfico de Sentimentos por Barra é uma ferramenta de análise técnica que mede a força e a direção do sentimento do mercado com base em cada barra (ou cada vela). Ele examina a relação entre os preços de abertura, máxima, mínima e fechamento de cada barra para determinar se o mercado exibiu comportamento altista, baixista ou neutro durante esse período.
Normalmente, um sentimento altista é identificado quando o preço de fechamento termina significativamente mais alto que a abertura, indicando forte pressão de compra. Um sentimento baixista é detectado quando o fechamento está notavelmente mais baixo que a abertura, sinalizando forte pressão de venda. Barras neutras, frequentemente chamadas de "dojis", refletem indecisão ou equilíbrio entre compradores e vendedores.
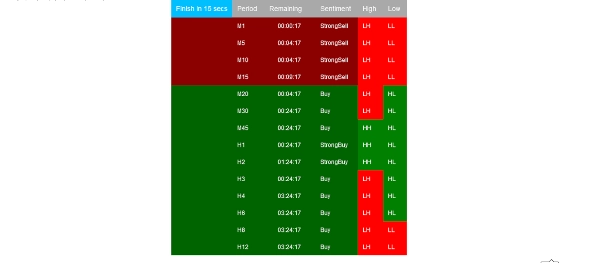
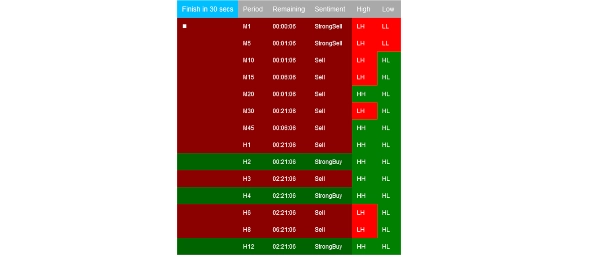
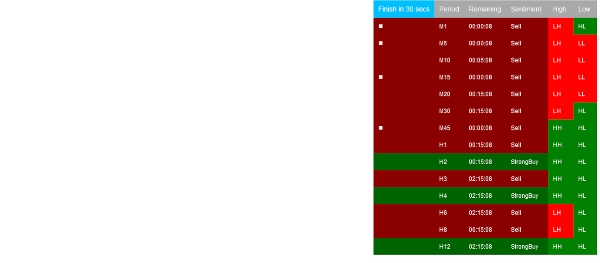
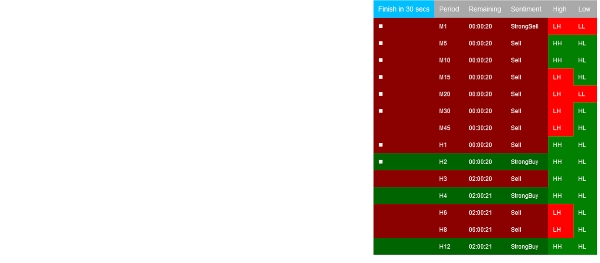
Versões avançadas do Indicador de Sentimentos por Barra podem incorporar elementos adicionais como volume, tamanho relativo do corpo ou momentum para refinar a classificação do sentimento. Os sentimentos são frequentemente visualizados por meio de codificação por cores—verde para altista, vermelho para baixista e cinza ou azul para neutro—facilitando a avaliação rápida do tom predominante do mercado.
Se 1s e 0s são os blocos fundamentais da engenharia de software, então a saída do Indicador de Gráfico de Sentimentos por Barra representa os blocos fundamentais dos sistemas avançados de negociação por aprendizado de máquina. Ao quantificar o sentimento bruto do mercado, ele fornece entradas essenciais para algoritmos que buscam aprender e prever movimentos futuros de preços com base no comportamento histórico.
Usando o Indicador de Gráfico de Sentimentos por Barra, os traders obtêm uma compreensão mais profunda da dinâmica micro do mercado, ajudando-os a identificar a força da tendência, potenciais reversões e períodos de consolidação—especialmente quando combinado com análise de múltiplos prazos e outras ferramentas técnicas.
Resumo
Advanced versions may integrate factors like volume, relative body size, or momentum to enhance sentiment accuracy. The indicator typically uses color-coding—green for bullish, red for bearish, and gray or blue for neutral—to visually represent market tone. By quantifying raw market sentiment, it provides foundational data useful for machine learning trading systems aiming to predict future price movements.
Traders can use this indicator to gain insight into micro market dynamics, helping to identify trend strength, potential reversals, and consolidation phases. It is particularly effective when combined with multi-timeframe analysis and other technical tools.
Avaliações de clientes
5 | 100 % | |
4 | 0 % | |
3 | 0 % | |
2 | 0 % | |
1 | 0 % |


