
FairValueGap
Indicador
2.15K transferências
Versão 1.0, Apr 2025
Windows, Mac
4.5
Avaliações: 2
Descrição
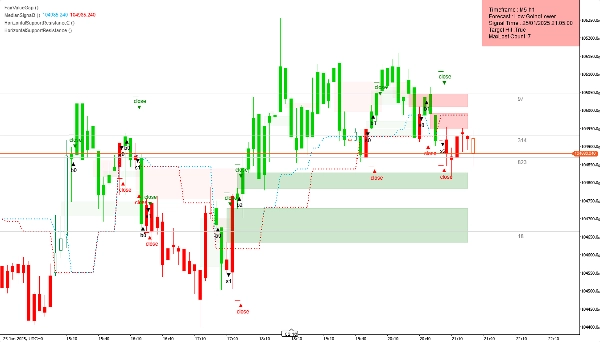
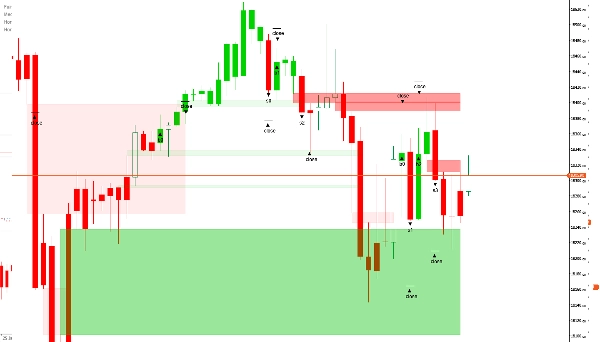
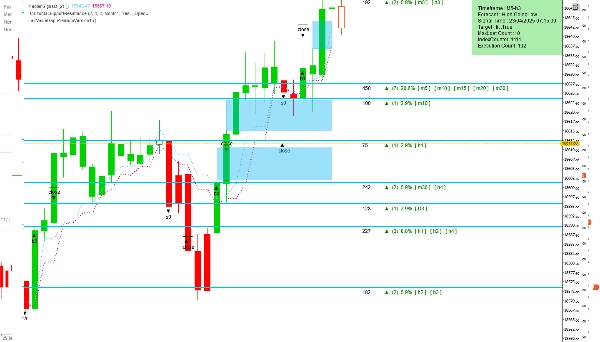
O indicador Fair Value Gap (FVG) é uma ferramenta de análise técnica projetada para identificar potenciais desequilíbrios de preço no mercado. Esses gaps ocorrem quando o preço se move rapidamente, criando uma zona com atividade mínima de negociação — frequentemente chamada de "vazio". Tais desequilíbrios podem indicar uma probabilidade de retração do preço, já que o mercado tende a buscar equilíbrio revisitando essas áreas.
Visão Geral das Configurações
- Barras a Carregar: Especifica o número de barras históricas a serem analisadas, começando pela mais recentemente concluída e retrocedendo.
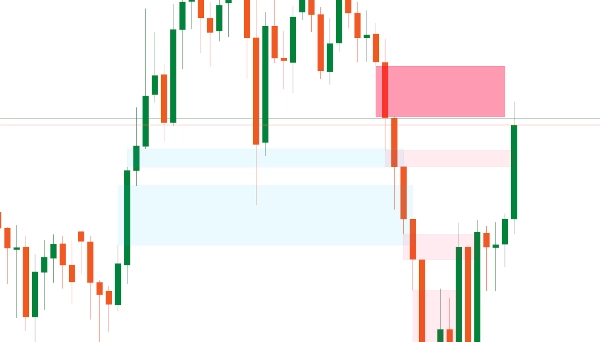
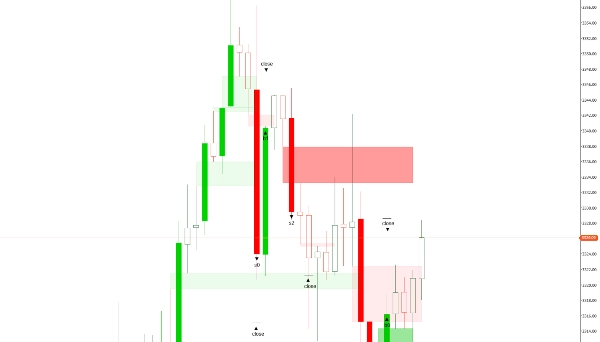
- Cor do FVG de Alta: Define a cor para os FVGs que aparecem em uma tendência de alta. Aplica-se uma transparência de 30% para que os elementos atrás do gap permaneçam visíveis.
- Cor do FVG de Baixa: Define a cor para os FVGs que aparecem em uma tendência de baixa, também com 30% de transparência para melhor visibilidade no gráfico.
Recursos Premium (Disponíveis na Versão Paga)
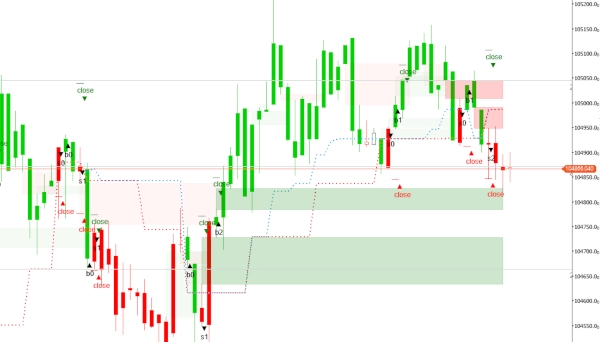
- Excluir Gaps Fechados: Uma configuração booleana — quando ativada ("sim"), remove automaticamente todos os gaps fechados; se desativada ("não"), os gaps permanecem visíveis. Isso é particularmente útil em timeframes menores (abaixo de 20 minutos).
- Editar/Remover Gaps: Permite que os traders ajustem ou excluam gaps manualmente. Isso oferece maior controle para traders experientes, especialmente porque gaps muito pequenos geralmente têm pouca influência no movimento do preço.
- Definir Timeframe: Oferece duas opções — usar o timeframe atual do gráfico ou selecionar um diferente para análise, exibindo os resultados no gráfico principal. Esse recurso ajuda os traders a obter insights mais rápidos sobre prováveis movimentos do mercado.
- Timeframe Selecionado: Especifica o timeframe desejado para análise caso "Timeframe Selecionado" seja escolhido na configuração acima.
- Precisão para Gaps Pequenos: Permite que os traders insiram um tamanho de gap preferido como um número inteiro, ajudando-os a identificar gaps que historicamente levam a resultados favoráveis. O valor é baseado no conjunto de dados completo e nos tamanhos de gaps observados para o ativo.
Por padrão, o indicador escaneia todos os desequilíbrios dentro de um único timeframe. No entanto, o acesso aos recursos premium através da FairValueGapPremium versão pode ampliar significativamente as capacidades analíticas.
Resumo
Resumo de IA
The Fair Value Gap (FVG) indicator is a technical analysis tool that identifies potential price imbalances in the market. These imbalances, or "gaps," occur when price moves rapidly, creating zones with minimal trading activity, often called "voids." Such areas may signal likely price retracements as the market tends to revisit these zones to restore balance.
Key settings include:
- Bars To Load: number of historical bars analyzed from the most recent backward.
- Bullish FVG Color: customizable color for gaps in uptrends with 30% transparency.
- Bearish FVG Color: customizable color for gaps in downtrends with 30% transparency.
Premium features (available in the paid version) enhance functionality by allowing:
- Automatic deletion of closed gaps, useful for lower timeframes.
- Manual editing or removal of gaps for finer control.
- Selection of analysis timeframe independent of the chart’s timeframe.
- Input of preferred gap size to improve identification accuracy based on historical data.
By default, the indicator scans imbalances within a single timeframe, with premium options providing expanded analytical capabilities.
Perfil do indicador
Avaliações de clientes
4.5
Avaliações: 2
5 | 50 % | |
4 | 50 % | |
3 | 0 % | |
2 | 0 % | |
1 | 0 % |
Avaliações de clientes
August 12, 2025
Pros: Automatically highlights the first session FVG and extends it to session end. Clean, minimal interface ideal for intraday analysis. Cons: No alerts or tooltips. Cannot save templates or track past session gaps.
August 6, 2025
Conversa
Perguntas frequentes
Os produtos disponíveis através da cTrader Store, incluindo bots de negociação, indicadores e plugins, são fornecidos por programadores terceiros e são disponibilizados apenas para fins informativos e de acesso técnico. A cTrader Store não é um corretor e não fornece aconselhamento em matéria de investimento, recomendações pessoais ou qualquer garantia de desempenho no futuro.


Também poderá gostar de


Preço
Desde 19/04/2025
284.21M
Volume negociado
1.08M
Pips ganhos
8
Vendas
3.46K
Instalações gratuitas