الوصف
نظرة عامة
يقوم هذا المؤشر بتنفيذ منهجية ألفريد فرانسوا تاجير "تحديد الاتجاه بواسطة تصفية السعر والوقت"، المنشورة في عدد فبراير 2024 من مجلة التحليل الفني للأسهم والسلع.
يجمع المفهوم بين حركة السعر والتصفية القائمة على الوقت لتقليل ضوضاء السوق وتحديد الاتجاهات المستمرة. بدلاً من التفاعل مع كل حركة سعر، يغير المؤشر اتجاه الاتجاه فقط عندما يغلق السعر خارج نطاق الفترة السابقة — وهو شرط يشير إلى زخم حقيقي بدلاً من تقلب عشوائي.
القواعد الأساسية
القواعد الأصلية بسيطة:
- إذا تجاوز إغلاق الفترة أعلى فترة سابقة → الاتجاه صاعد
- إذا كان إغلاق الفترة أقل من أدنى فترة سابقة → الاتجاه هابط
- يبقى الاتجاه دون تغيير حتى يحدث شرط انعكاس
تقوم هذه الطريقة بتصفية تحركات السعر الطفيفة التي تبقى ضمن نطاق الفترة السابقة، مع التركيز فقط على الاختراقات التي تظهر التزاماً.
كيف يعمل
يقارن المؤشر إغلاق الإطار الزمني الحالي مع أعلى وأدنى فترة سابقة للإطار الزمني الأعلى المختار:
- اتجاه صاعد: الإغلاق الحالي > أعلى الفترة السابقة
- اتجاه هابط: الإغلاق الحالي < أدنى الفترة السابقة
- لا تغيير: يبقى الإغلاق ضمن نطاق الفترة السابقة
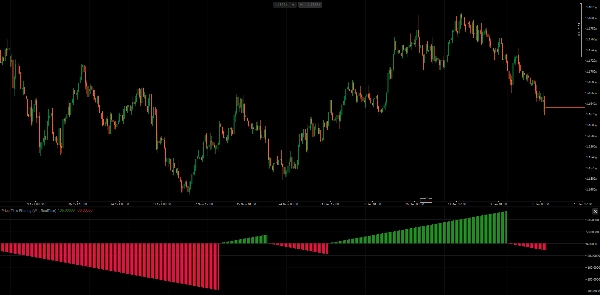
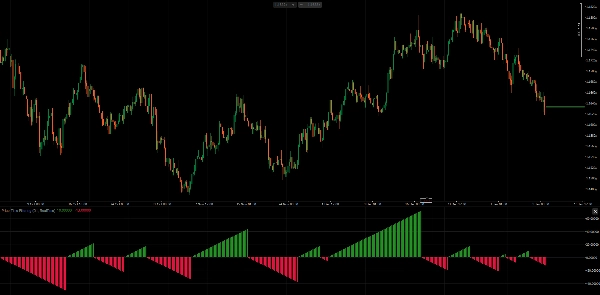
يعرض المدرج التكراري عدداً متزايداً من الأعمدة في اتجاه الاتجاه الحالي — قيم موجبة للاتجاهات الصاعدة، وقيم سالبة للاتجاهات الهابطة. هذا يصور كل من اتجاه ومدة الاتجاه.
أنماط التصفية
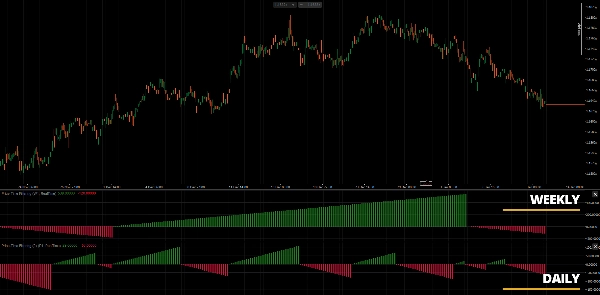
1. وضع نهاية الفترة يقيم الاتجاه فقط عند اكتمال فترة إطار زمني أعلى. هذا يتطابق مع المنهجية الأصلية حيث يتم تحديد الاتجاه الأسبوعي بإغلاق يوم الجمعة (أو إغلاق نهاية الشهر للشهري). أكثر استقراراً، إشارات أقل.
2. الوضع الزمني الحقيقي يقيم الاتجاه على كل عمود باستخدام الإغلاق الحالي مقابل نطاق الفترة السابقة. يوفر إشارات مبكرة لكنه قد ينتج ضوضاء أكثر خلال الفترة.
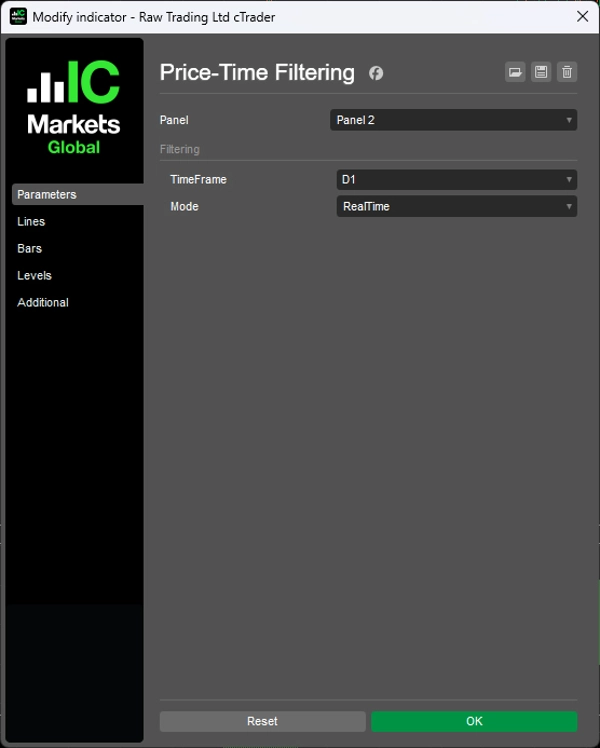
المعلمات
- الإطار الزمني: إطار زمني أعلى لتقييم الاتجاه (مثلاً، أسبوعي، شهري)
- الوضع: نهاية الفترة (المنهجية الأصلية) أو الوقت الحقيقي (النسخة الاستجابية)
التفسير
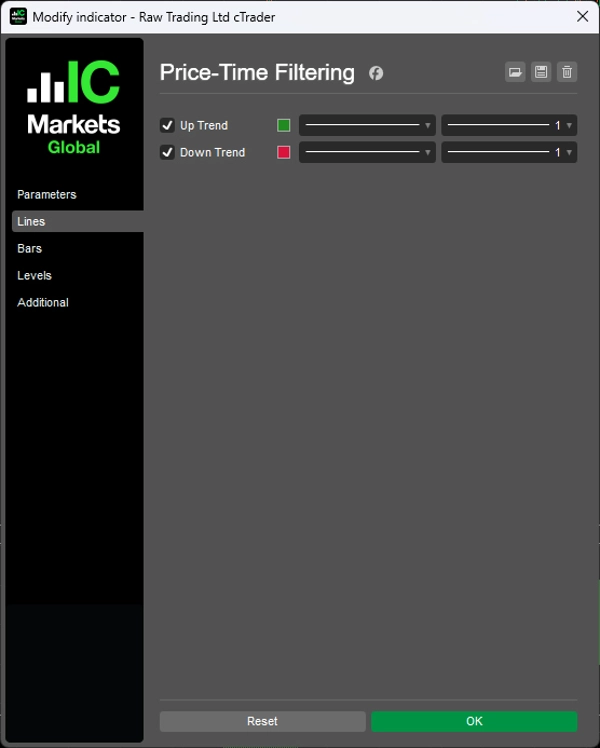
- المدرج التكراري الأخضر: اتجاه صاعد جاري، عدد الأعمدة يظهر المدة
- المدرج التكراري الأحمر: اتجاه هابط جاري، عدد الأعمدة يظهر المدة
- إعادة تعيين المدرج التكراري: حدث انعكاس الاتجاه
يعمل المؤشر بشكل أفضل على الرسوم البيانية اليومية مع اختيار الإطار الزمني الأسبوعي أو الشهري، كما هو موضح في المقالة الأصلية. ومع ذلك، تدعم التنفيذ أي تركيبة إطار زمني.
ملاحظات
- مصمم أصلاً للرسوم البيانية اليومية مع تقييم أسبوعي/شهري
- يعمل على أي تركيبة إطار زمني حيث يكون الإطار الزمني المختار أعلى من إطار الرسم البياني
- يوفر عدد الأعمدة مقياساً لنضج الاتجاه — الأعداد الأطول تشير إلى اتجاهات راسخة
- فكر في الجمع مع تحليل هيكل السعر لتوقيت الدخول
المرجع
تاجير، ألفريد فرانسوا. "تحديد الاتجاه بواسطة تصفية السعر والوقت." التحليل الفني للأسهم والسلع، فبراير 2024.
__________________________________________________________________________________________
مزيد من المؤشرات المجانية
استكشف مجموعة واسعة من أدوات تحليل السوق — من الهيكل والحجم إلى الانحدار، التقلبات، والأطر الزمنية المخصصة.
رمز المصدر متاح على مستودع GitHub.
جميعها مجانية للاستخدام. ولكن إذا رغبت في دعم القهوة، يمكنك التبرع هنا.
الدعم/المقاومة
الحجم
- محلل نشاط الحجم
- محلل كفاءة الحجم
- تحليلات ملف الحجم
- ملف الحجم - محدث
- تحليل انتشار الحجم
- VWAP (متوسط السعر المرجح بالحجم)
المتوسطات المتحركة
- قناة SSL
- المتوسط المتحرك المثبت
- المتوسط المتحرك بمقياس الانحراف
- منشط جان العالي والمنخفض
- خط الاتجاه اللحظي
- متوسط كوفمان التكيفي مع رؤية الاتجاه
- قناة المتوسط المتحرك
- مجموعة المتوسطات المتحركة
- متوسط قناة الاتجاه المتحرك
الأدوات/المخصصة
مبني على الانحدار
التقلب
المذبذبات
__________________________________________________________________________________________
إخلاء المسؤولية
التداول ينطوي على مخاطر. هذا المؤشر مخصص للتحليل الفني فقط — دائماً طبق إدارة المخاطر المناسبة وتداول بمسؤولية.
التعليقات والتحسينات
إذا كانت لديك اقتراحات، طلبات ميزات، أو أفكار لتحسين، يرجى ترك تعليق في تبويب النقاش. تساعد ملاحظاتك في تحسين المؤشر للجميع.
الملخص
The indicator supports two filtering modes: PeriodEnd mode, which evaluates trends only at the close of a higher timeframe period (e.g., weekly or monthly), providing more stable signals; and RealTime mode, which updates trend status on every bar for more responsive but potentially noisier signals. Users can select the higher timeframe for trend evaluation, typically weekly or monthly, while applying the indicator on lower timeframe charts.
A histogram visually represents trend direction and duration, with positive values and green bars indicating uptrends, negative values and red bars indicating downtrends, and resets marking trend reversals. The indicator is applicable across various markets including Forex, indices, commodities, crypto, and stocks, and supports any timeframe combination where the selected higher timeframe exceeds the chart timeframe.