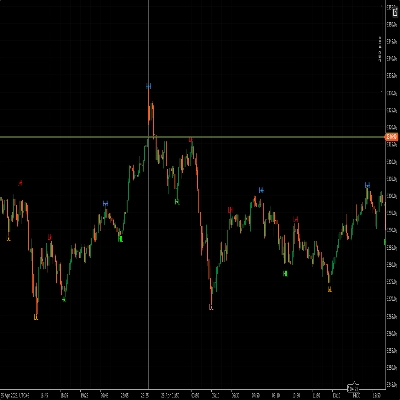
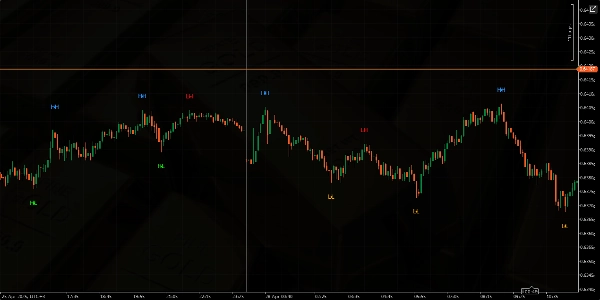
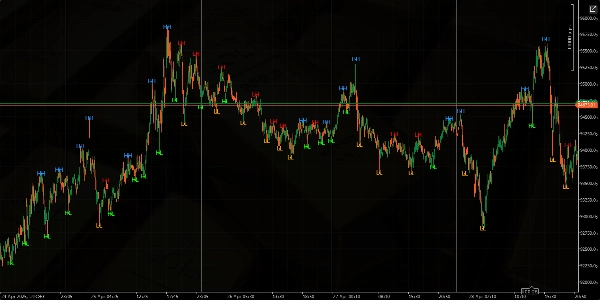
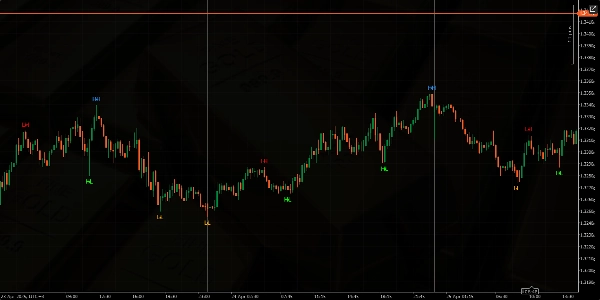
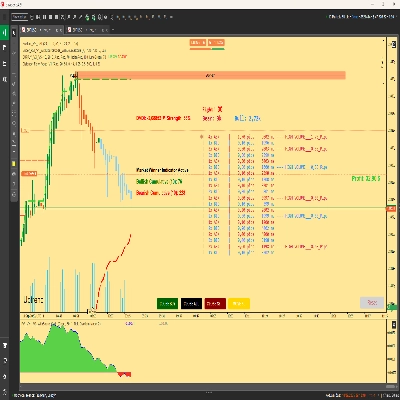
Higher Highs Lower Lows
Indicador
47 transferências
Versão 1.0, Apr 2025
Windows, Mac

Descrição
Resumo
Perfil do indicador
Avaliações de clientes
0.0
Avaliações: 0
Avaliações de clientes
Ainda não há avaliações para este produto. Já o experimentou? Seja o primeiro a contar a outras pessoas!
Conversa
Perguntas frequentes
Os produtos disponíveis através da cTrader Store, incluindo bots de negociação, indicadores e plugins, são fornecidos por programadores terceiros e são disponibilizados apenas para fins informativos e de acesso técnico. A cTrader Store não é um corretor e não fornece aconselhamento em matéria de investimento, recomendações pessoais ou qualquer garantia de desempenho no futuro.
Mais deste autor


![Logótipo de "[Stellar Strategies] BOS Trend 1.0"](https://cdn.ctrader.com/image/webp/6cdec0f1-0e97-4a82-a8a4-2b67aed54d38_25695)


Preço
Desde 16/03/2025
256
Instalações gratuitas