present
Зарегистрируйтесь и получите скидку $50 на первую покупку
Trading product for EMA_RTH Индикатор, image 1
EMA_RTH
С 19/05/2025
82
Бесплатные установки

Описание

EMA, рассчитанная за выбранный вами пользовательский период/сессию

Сводка

ИИ-сводка
EMA_RTH is a technical indicator that calculates the Exponential Moving Average (EMA) based on a custom period or trading session defined by the user. This flexibility allows traders to tailor the EMA calculation to specific market hours or timeframes relevant to their trading strategy. The indicator focuses on providing EMA values derived from user-selected sessions rather than standard fixed periods, enabling more precise analysis aligned with particular trading sessions.
Профиль индикатора

Обсуждение

Отзывы покупателей

0.0
Отзывы: 0
Отзывы покупателей
У этого продукта еще нет отзывов. Уже попробовали его? Поделитесь впечатлениями!

Частые вопросы

Продукты, доступные в cTrader Store, включая торговых ботов, индикаторы и плагины, предоставляются сторонними разработчиками и доступны исключительно в информационных и технических целях. cTrader Store не является брокером и не предоставляет инвестиционные консультации, персональные рекомендации или какие-либо гарантии будущей доходности.

Больше от этого автора
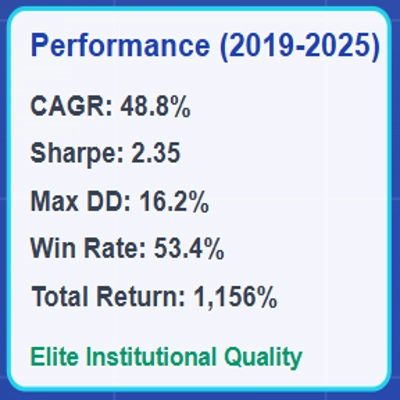
NAS100 Gap-and-Go is an institutional-quality systematic trading algorithm that identifies and trades gap continuation

Вам также может понравиться

"Advanced VSA & CVD indicator with 'A+ Setup' filtering based on Support & Resistance levels."
The Professional “All-in-One” Trading Suite (buy and sell indicator)
Логотип продукта "RangePulsePro"
5.0
(1)
$35
AI-powered daily range forecasts help traders spot volatility opportunities and plan stops and targets.
Master trends with Smart ADX: MTF Scanner, precise Buy/Sell signals, Divergence & clear Exit targets 🎯
Opening ranges, dynamic trend channels, and multi-scale breakout/retest analysis for clear intraday chart decisions.
Fair Value Gaps with Multi-Timeframe.
Логотип продукта "KANDIKA HEAT MAP"
4.6
(5)
$19
Color-Based Market Pressure & Volatility Visualizer The Kandika Heatmap Indicator
The Linear Regression Oscillator (LRO) is a technical indicator based on linear regression analysis.
Laser entries with pivot confirmation. No repaint, all timeframes. Professional results.
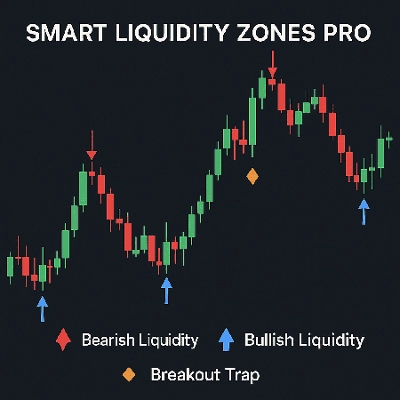
Smart Liquidity Zones PRO auto-detects liquidity grabs, wicks, traps & manipulations — trade like the smart money.
This is the trial version of Time To Break Even, which help you time your trade entry.
Rejection-based volume profile with tiered heat zones, POC levels and a fully draggable anchor on cTrader.
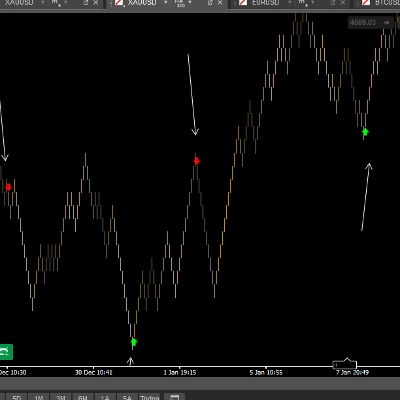
Professional Trading Indicator Transform Your Trading with Intelligent Signal Detection RenkoProfit
Advanced volume‑profile tool with delta, HVN/LVN zones, and precise POC‑based trade signals.
Логотип продукта "FAIR VALUE GAP INDICATOR"
4.7
(4)
$19
/
$25
Pinpoint FVGs, track fills and see mitigation stats — trade imbalances with clarity and confidence.
GOLD SENTINEL v1.0 - A CANDLE-COLORING INDICATOR FOR GOLD.
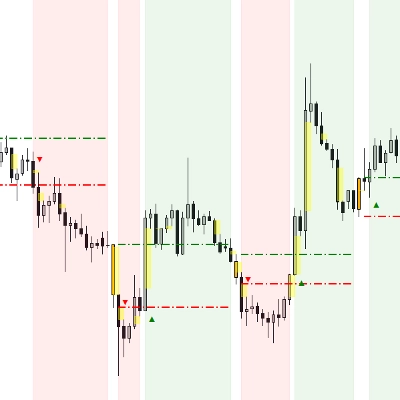
Spots key hourly ranges and signals breakouts using arrows & colored background zones. Ideal for Gold.
This extraordinary multi-timeframe support and resistance indicator is nothing short of market wizardry.

Цена

С 19/05/2025
82
Бесплатные установки