
Zero Lag Exponential Moving Average
Indikator
259 unduhan
Versi 1.0, Aug 2025
Windows, Mac
Deskripsi
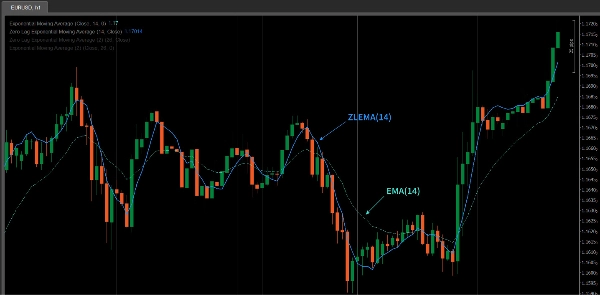
The ZLEMA (Zero Lag Exponential Moving Average) adalah versi lanjutan dari Exponential Moving Average (EMA) yang dirancang untuk mengurangi lag yang biasanya terkait dengan EMA tradisional. Dengan menggunakan metode perhitungan khusus, ZLEMA bereaksi lebih cepat terhadap perubahan harga, sehingga sangat efektif di pasar yang volatil.
Fitur utama dari ZLEMA adalah karakteristik "zero lag"-nya, yang memungkinkan mengikuti pergerakan harga lebih dekat, terutama dalam kondisi pasar yang bergerak cepat. Dibandingkan dengan EMA tradisional, ZLEMA menawarkan waktu respons yang lebih cepat, sehingga lebih tepat waktu dalam menangkap tren pasar.
ZLEMA vs EMA
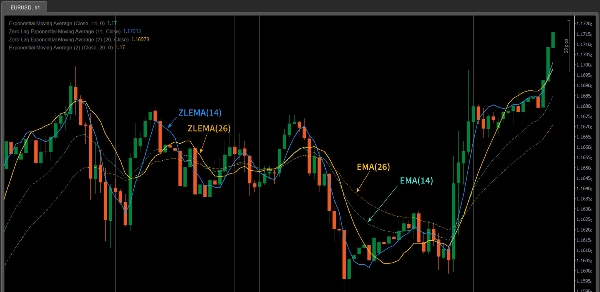
- Response Speed: ZLEMA bereaksi lebih cepat daripada EMA tradisional. Dengan mengompensasi lag, ia mengikuti perubahan harga dengan lebih cepat.
- Smoothing Effect: ZLEMA mempertahankan efek pelunakan yang mirip dengan EMA, sambil meminimalkan lag harga, sehingga lebih cocok untuk pasar yang bergerak cepat.
- Use Case: Jika Anda berdagang di pasar yang sangat volatil (seperti perdagangan jangka pendek atau intraday), ZLEMA dapat mengungguli EMA dalam hal responsivitas.
Fitur Indikator ZLEMA
- Zero Lag Response: ZLEMA mengurangi lag, memungkinkan untuk merespons dengan cepat terhadap fluktuasi harga pasar, sehingga lebih akurat dalam menangkap perubahan pasar yang cepat.
- Smoothness: Meskipun menawarkan respons yang lebih cepat, ZLEMA mempertahankan efek pelunakan dari EMA, membantu menghindari noise yang disebabkan oleh fluktuasi harga.
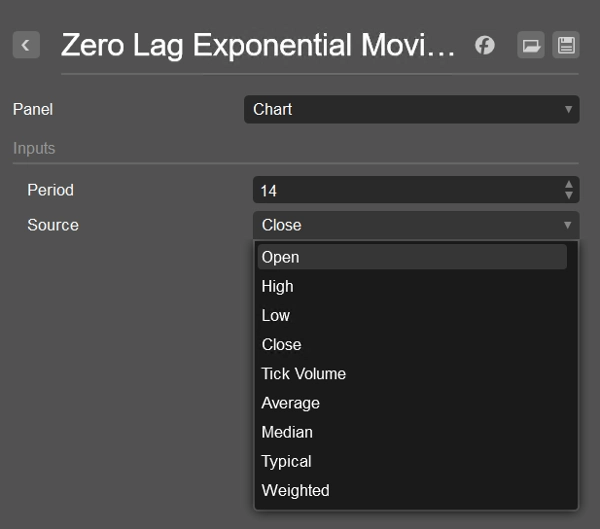
- Flexibility: ZLEMA dapat digunakan dengan berbagai sumber data harga (seperti
Close,Open,High, dll.), memungkinkan trader menyesuaikannya berdasarkan kebutuhan strategi mereka. - Trend Following and Reversal Signal Confirmation: ZLEMA ideal untuk mengidentifikasi perubahan tren, terutama di pasar yang volatil, dan mengonfirmasi sinyal pembalikan harga.
Cara Menggunakan Indikator ZLEMA
- Short-Term Traders: ZLEMA sangat cocok untuk trader jangka pendek karena dapat merespons dengan cepat terhadap fluktuasi harga. Reaksi cepatnya membuatnya ideal untuk menangkap pembalikan tren jangka pendek atau sinyal breakout.
- Trend Following: ZLEMA juga dapat digunakan untuk melacak tren jangka panjang tetapi menawarkan sensitivitas lebih tinggi dibandingkan EMA. Dalam tren yang kuat, ZLEMA membantu mengidentifikasi awal atau akhir tren lebih cepat, membantu penyesuaian strategi tepat waktu.
- Combining with Other Indicators: ZLEMA bekerja dengan baik jika dikombinasikan dengan indikator teknikal lain seperti RSI, MACD, atau analisis pola harga untuk meningkatkan akurasi sinyal. Ini sangat berguna jika digabungkan dengan indikator pengikut tren seperti moving averages untuk mengonfirmasi breakout atau pembalikan harga.
- Confirming Breakouts and Reversals: ZLEMA dapat membantu mengonfirmasi breakout harga dari level kunci atau sinyal pembalikan. Misalnya, ketika harga melintasi garis ZLEMA, itu bisa menunjukkan perubahan tren, dan sebaliknya.
- Noise Reduction: Karena lag yang berkurang, ZLEMA lebih baik dalam menyaring noise yang mungkin ada pada moving averages tradisional, menjadikannya alat penting dalam perdagangan intraday atau pasar yang sangat volatil.
Tips Menggunakan ZLEMA
- Adjust the Period: Sesuaikan periode ZLEMA berdasarkan gaya trading dan volatilitas pasar Anda. Untuk perdagangan jangka pendek, gunakan periode yang lebih pendek (misalnya, 10 atau 14), sementara untuk pelacakan tren jangka panjang, periode yang lebih panjang (misalnya, 50 atau 100) mungkin lebih tepat.
- Combine with Other Tools: Meskipun ZLEMA memberikan kemampuan pengikut tren yang sangat baik, menggabungkannya dengan indikator lain seperti RSI untuk kondisi overbought/oversold atau MACD untuk kekuatan tren dapat meningkatkan akurasi.
- Testing and Optimization: Performa ZLEMA dapat bervariasi di berbagai kondisi pasar. Disarankan untuk melakukan backtest dan optimasi secara menyeluruh sebelum menggunakannya dalam trading langsung untuk memastikan hasil terbaik dalam strategi Anda.
Ringkasan
Ringkasan AI
The Zero Lag Exponential Moving Average (ZLEMA) is an advanced technical indicator designed to improve upon the traditional Exponential Moving Average (EMA) by reducing lag. It achieves faster response times to price changes while maintaining the smoothing effect of EMA, making it suitable for capturing quick market shifts and trends, especially in volatile or fast-moving markets.
Key features include:
- Zero lag response for timely reaction to price fluctuations.
- Smoothness that filters out noise without sacrificing responsiveness.
- Flexibility to use various price data inputs such as Close, Open, or High prices.
- Utility in trend following and confirming reversal signals.
ZLEMA is particularly useful for short-term traders seeking to capture rapid trend reversals or breakouts, as well as for longer-term trend tracking with enhanced sensitivity compared to EMA. It can be combined with other indicators like RSI or MACD to improve signal accuracy and confirm price breakouts or reversals.
Users can adjust the indicator’s period to match their trading style and market conditions, optimizing performance through backtesting. ZLEMA helps reduce noise and lag, making it a valuable tool for intraday and volatile market trading.
Profil indikator
Ulasan pelanggan
0.0
Ulasan: 0
Ulasan pelanggan
Belum ada ulasan untuk produk ini. Sudah mencobanya? Jadilah pemberi ulasan pertama!
Diskusi
Pertanyaan umum
Produk-produk yang tersedia melalui cTrader Store, termasuk bot trading, indikator, dan plugin, disediakan oleh pengembang pihak ketiga serta hanya ditujukan untuk akses teknis dan informasi. cTrader Store bukan broker dan tidak menyediakan saran investasi, rekomendasi pribadi, atau jaminan apa pun tentang kinerja di masa mendatang.


![Logo "[Stellar Strategies] Market Session Ultimate"](https://cdn.ctrader.com/image/webp/61ffd537-0125-4246-9e72-42eca1791d64_28232)


Harga
Sejak 14/07/2025
259
Instal gratis