
Описание
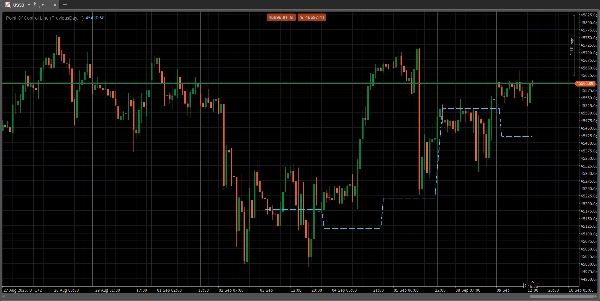
Точка контроля (POC) — это уровень цены на графике объемного профиля, на котором за указанный период был проведен наибольший объем торгов. Этот уровень выступает в качестве значимой зоны поддержки или сопротивления, поскольку он представляет цену, где крупные торговые учреждения были наиболее активны и где рыночная цена достигла консенсуса. Трейдеры используют POC для определения ключевых ценовых зон, оценки рыночного настроения и прогнозирования потенциальных движений и разворотов цены.
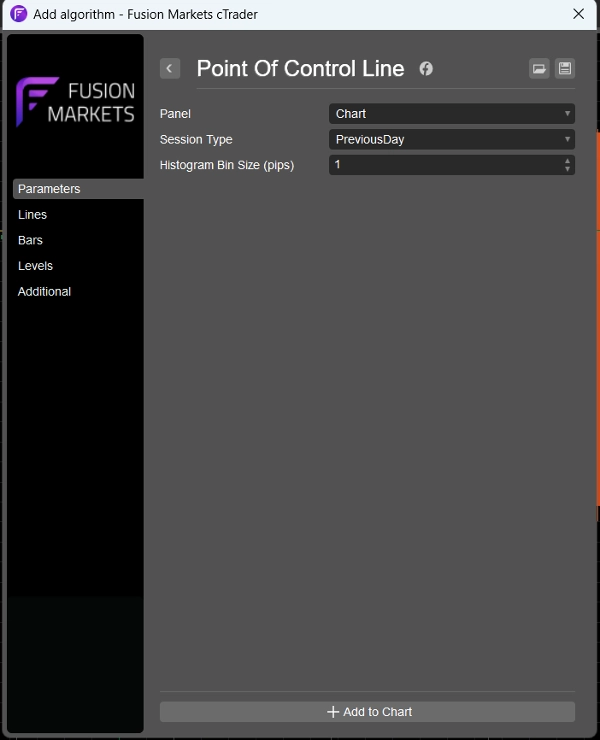
Я удалил весь шум из обычных индикаторов объемного профиля, оставив только линию POC для тех, кому нужна только эта линия. Я включил параметр для просмотра линии POC за предыдущий день, 4 часа или 1 час объемного профиля, чтобы она подходила трейдерам с разными таймфреймами.
Сводка
Отзывы покупателей
5 | 100 % | |
4 | 0 % | |
3 | 0 % | |
2 | 0 % | |
1 | 0 % |


