
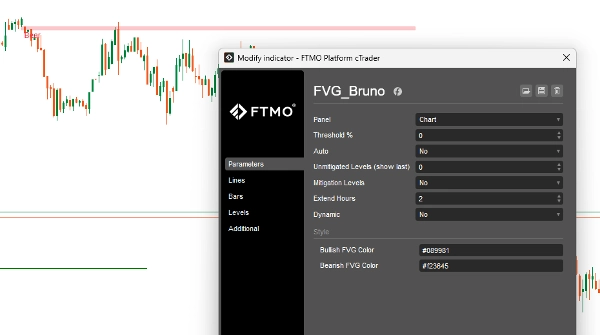
FVG_Bruno
Indicador
Versión 1.0, Oct 2025
Windows, Mac
4.0
Valoraciones: 2
Descripción
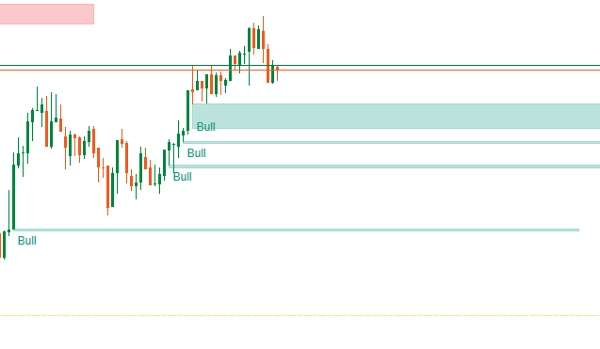
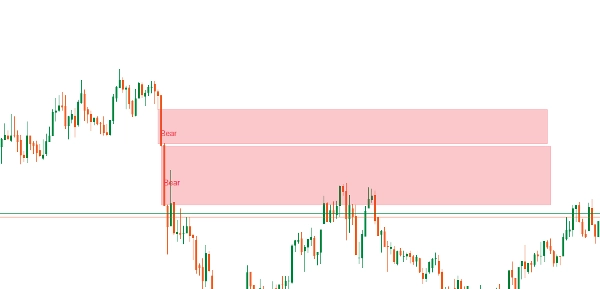
Un FVG es un desequilibrio de precio que ocurre cuando el mercado se mueve agresivamente en una dirección, dejando un espacio entre velas consecutivas. Este espacio representa un área donde la liquidez no se intercambió completamente, y el precio a menudo vuelve a visitarlo más tarde para “llenar” el desequilibrio.
Por ejemplo:
- En un movimiento alcista, si la Vela 1 cierra y la Vela 3 abre muy por encima del máximo de la Vela 1, dejando sin probar el mínimo de la Vela 2, ese espacio es un FVG.
- Los traders esperan que el precio retroceda hacia este espacio antes de continuar la tendencia.
Resumen
Perfil del indicador
Valoraciones de clientes
4.0
Valoraciones: 2
5 | 0 % | |
4 | 100 % | |
3 | 0 % | |
2 | 0 % | |
1 | 0 % |
Conversación
Preguntas frecuentes
BTCUSD
Forex
Signal
Indices
EURUSD
Commodities
GBPUSD
NZDUSD
Prop
Fair Value Gap
Crypto
Stocks
XAUUSD
NAS100
USDJPY
Los productos disponibles a través de cTrader Store, incluidos bots, indicadores y plugins para operar, son proporcionados por desarrolladores de terceros y están disponibles únicamente con fines informativos y de acceso técnico. cTrader Store no es un bróker, por lo que no proporciona asesoramiento de inversión, recomendaciones personales ni ninguna garantía de rentabilidad futura.
Más de este autor


Precio
Desde 22/10/2025
303.42M
Volumen operado
49
Pips ganados
1
Ventas