Описание
TRB — Индикатор Tick Runs Bars
Обнаружение информации о рынке до движения цены
Временное вводное предложение для ранних пользователей - обеспечьте себе копию сейчас по сниженной цене, прежде чем цена повысится до стандартной розничной стоимости после окончания начального периода выпуска.
Версия 1.1
Используйте раздел комментариев, чтобы задать дополнительные вопросы
Доступна видеосессия с руководством по настройке после покупки
ИНДИКАТОР TICK RUNS BARS (TRB)
Tick Runs Bars расширяет анализ микроструктуры рынка, обнаруживая направленную устойчивость в торговом потоке. Также основанный на работе Маркоса Лопеса де Прадо Advances in Financial Machine Learning, этот индикатор выявляет, когда одностороннее рыночное давление отклоняется от ожидаемых уровней — раскрывая институциональное дробление ордеров и скоординированную торговую активность.
Основная идея
Институциональные трейдеры стратегически выполняют крупные ордера — они дробят их на меньшие части, скрывают объем за айсберг-ордерами или используют алгоритмическое исполнение, чтобы не влиять на рынок. Эти тактики оставляют характерные отпечатки в виде устойчивых односторонних торговых серий. Tick Runs Bars обнаруживает эти паттерны, измеряя, как долго одна сторона доминирует в потоке ордеров, показывая, когда происходит целенаправленное агрессивное размещение ордеров, а не случайные колебания цены.
Как это работает
Индикатор рассчитывает длину объемов покупок и продаж отдельно — не вычитая их друг из друга, как традиционные метрики дисбаланса. Он отслеживает максимальное накопление одностороннего объема (θT) относительно динамического ожидаемого порога, основанного на исторической вероятности покупок/продаж и средних объемах. Когда фактические направленные серии превышают ожидания, создается новая TRB-свеча. Это раскрывает «структурную форму» исполнения ордеров — подпись работы институциональных игроков.
Ключевые особенности
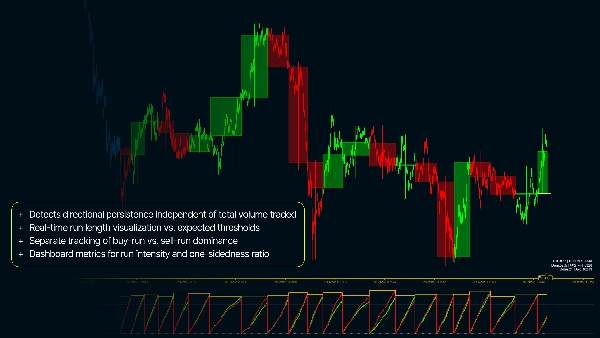
- Обнаруживает направленную устойчивость независимо от общего объема торгов
- Визуализация длины серий в реальном времени по сравнению с ожидаемыми порогами
- Отдельное отслеживание доминирования покупок и продаж
- Окраска свечей на графике по принадлежности к TRB, показывающая фазы исполнения ордеров
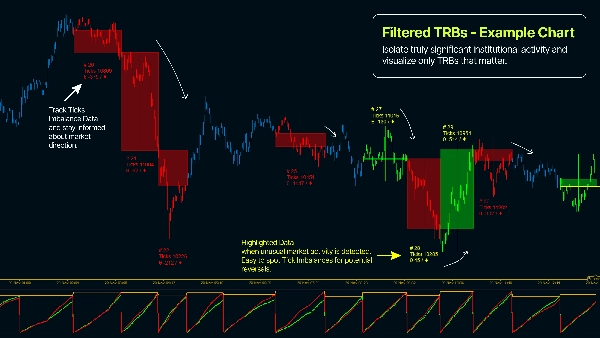
- Фильтр минимального объема для выделения действительно значимой институциональной активности
- Метрики панели для интенсивности серий и коэффициента односторонности
- Настраиваемые параметры ожидаемого размера свечи и EWMA, адаптированные к волатильности инструмента
Зачем использовать Tick Runs Bars?
- Определять исполнение институциональных ордеров в реальном времени — до их завершения
- Обнаруживать скрытую ликвидность и паттерны айсберг-ордеров через анализ потока
- Различать скоординированную торговлю и случайный рыночный шум
- Фиксировать движение цены, вызванное структурными дисбалансами ордеров, а не только статистическими аномалиями
- Выполнять входы/выходы в периоды известного институционального участия
- Применять продвинутую теорию микроструктуры рынка для получения преимущества на более быстрых таймфреймах
- Снижать количество ложных сигналов от незначительных розничных торговых всплесков


![Логотип продукта "Gaussian Channel [Iridio Capital]"](https://cdn.ctrader.com/image/webp/7c039209-5573-4a54-a072-f9528b503103_41960)


