
Описание
TrendFallowing: это продвинутый технический индикатор для платформы cTrader, который объединяет несколько аналитических подходов в одном решении. Разработан для трейдеров, ищущих подтверждение тренда через схождение индикаторов, он предлагает полный обзор рынка с точными сигналами и фильтрами валидации.
СМОТРИТЕ ВВОДНОЕ ВИДЕО О РАБОЧЕЙ СТРАТЕГИИ!
🎯 СТРАТЕГИИ ИСПОЛЬЗОВАНИЯ
1. Торговля по тренду
Применение: Определение и следование установленным трендам
Таймфрейм: H4, D1 для долгосрочных позиций
Настройки: ADX > 25, объем выше среднего
Управление рисками: Стоп-лосс ниже 50-периодной скользящей средней
2. Свинг-трейдинг
Применение: Захват среднесрочных движений
Таймфрейм: H1, H4
Настройки: Включен фильтр объема, подтверждение по Volume Profile
Цели: Volume Profile POC в качестве TP
3. Торговля на пробоях
Применение: Вход при пробоях уровней поддержки/сопротивления
Настройки: Объем PVA для подтверждения силы движения
Подтверждение: Рост ADX + объем выше среднего
4. Скальпинг (короткие таймфреймы)
Применение: Быстрые сделки с множественными подтверждениями
Таймфрейм: M1, M5
Настройки: Строгие фильтры объема и Momentum
🔧 КАК РАБОТАЮТ ИНДИКАТОРЫ
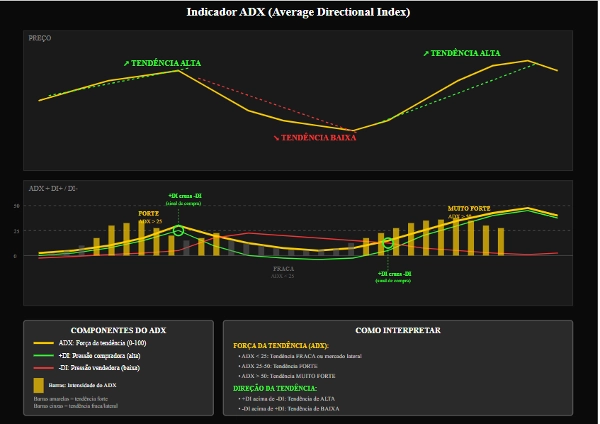
ОСНОВНОЙ ADX & DI
ADX (Средний индекс направленности)
Функция: Измерение силы тренда
Интерпретация:
0-25: Слабый тренд/боковое движение
25-50: Сильный тренд
50+: Очень сильный тренд
Практическое использование: Избегать сделок при ADX < 20
+DI / -DI (Направленные индикаторы)
+DI: Сила покупателей
-DI: Сила продавцов
Сигнал: Пересечение +DI выше -DI (покупка) и наоборот
Наклон ADX (ADX Slope)
Функция: Измерение ускорения тренда
График: Голубой гистограмма
Сигнал: Положительные значения указывают на усиление тренда
ФИЛЬТРЫ ОБЪЕМА
Фильтр объема MA
Функция: Подтверждение сигналов объемом выше среднего
Параметры: Период 20, множитель 1.0
Использование: Подтверждение институционального интереса
Объем PVA (Анализ цены и объема)
Цвета и значение:
Зеленый: Покупка с очень высоким объемом (>150% среднего)
Синий: Покупка с высоким объемом
Красный: Продажа с очень высоким объемом
Розовый: Продажа с высоким объемом
Желтый: Пин-бар/истощение с пробоем поддержки
VOLUME PROFILE
POC (Точка контроля)
Функция: Цена с наибольшим объемом торгов
Использование: Естественная цель для сделок, динамическая поддержка/сопротивление
Зона стоимости
Функция: Зона, где было совершено 70% объема торгов
Интерпретация:
Цена выше: Восходящий тренд
Цена ниже: Нисходящий тренд
Внутри: Возможное боковое движение
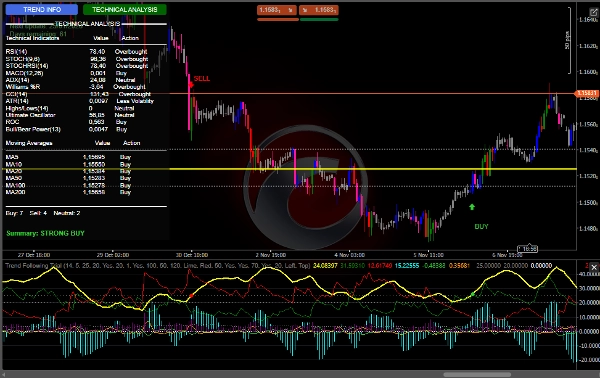
Панель индикаторов
RSI: Перепроданность (<30) / Перекупленность (>70)
MACD: Моментум
Williams %R: Экстремальные условия
CCI: Определение разворота
Стохастик: Краткосрочный моментум
Ultimate Oscillator: Моментум на нескольких таймфреймах
Скользящие средние
Полный набор скользящих средних (5, 10, 20, 50, 100, 200)
Анализ выравнивания для трендов
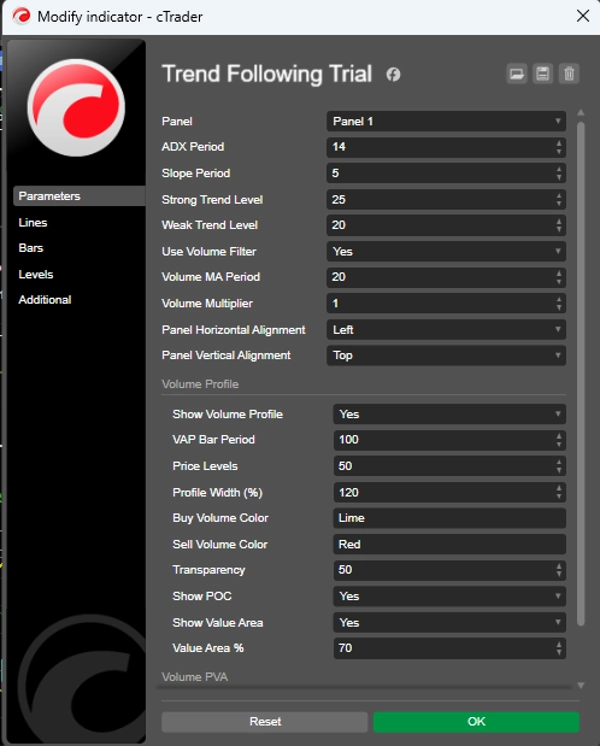
⚙️ РЕКОМЕНДУЕМЫЕ НАСТРОЙКИ
Консервативные настройки
Период ADX: 14
Период наклона: 5
Уровень сильного тренда: 25
Уровень слабого тренда: 20
Использовать фильтр объема: true
Период MA объема: 20
Множитель объема: 1.2
Агрессивные настройки
Период ADX: 10
Период наклона: 3
Уровень сильного тренда: 20
Уровень слабого тренда: 15
Использовать фильтр объема: true
Период MA объема: 14
Множитель объема: 1.0
Volume Profile (Рекомендуется)
Показать Volume Profile: true
Период VAP Bar: 100
Ценовые уровни: 50
Процент зоны стоимости: 70
Показать POC: true
🎨 ВИЗУАЛЬНЫЕ РЕСУРСЫ
Пользовательский интерфейс
Динамическая панель: Информация в реальном времени
Интерактивные кнопки: Переключение между анализами
Интуитивные цвета: Кодирование по функциям
Графические сигналы
Стрелки: Входы BUY/SELL
Звуки: Звуковые оповещения
Цвета баров: Интегрированный анализ PVA


