الوصف
ماسح الاتجاه متعدد الأطر الزمنية – اقرأ القصة الكاملة للسوق بنظرة واحدة
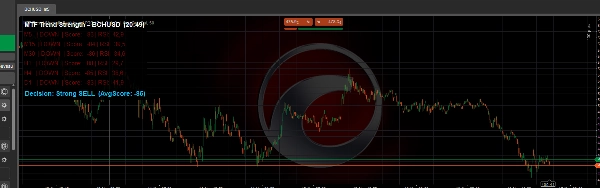
ماسح الاتجاه متعدد الأطر الزمنية يمنحك عرضًا نظيفًا ومضغوطًا للاتجاه عبر عدة أطر زمنية مباشرة على مخطط cTrader الخاص بك – من M5 حتى D1 – بالإضافة إلى تحيز تداول واضح شامل:
➡️ شراء قوي / شراء / محايد / بيع / بيع قوي
بدلاً من التنقل بين المخططات والتخمين، تحصل على خريطة اتجاه متعددة الأطر الزمنية منظمة في مكان واحد.
🧠 محرك نقاط الاتجاه الذكي
لكل إطار زمني مفعل (M5، M15، M30، H1، H4، D1)، يحسب المؤشر نقاط اتجاه قوية باستخدام ثلاثة مكونات رئيسية:
- 📈 EMA (اتجاه وميل الاتجاه)
-
- السعر مقابل EMA (أعلى/أسفل)
- ميل EMA (صاعد/هابط)
- 💪 RSI (زخم)
-
- مُعادل حول مستوى 50
- 🌊 ATR (مرشح التقلبات الاختياري)
-
- تجاهل اختياري لظروف التقلبات المنخفضة جدًا
يحصل كل إطار زمني على درجة في النطاق -100 إلى +100، ثم تُترجم إلى حالة سهلة:
- 🟢 صاعد – تحيز صعودي
- 🔴 هابط – تحيز هبوطي
- 🟡 مستقر – جانبي / غير واضح
ترى فورًا أي الأطر الزمنية تتفق وأين يكون التحيز الاتجاهي الحقيقي.
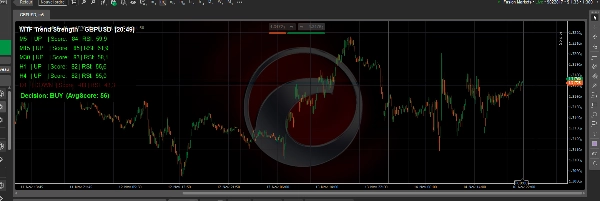
📊 لوحة تحكم نظيفة وخفيفة على المخطط
يرسم الأداة لوحة واجهة مستخدم صغيرة فوق مخططك، مصممة لتكون قابلة للقراءة ولكن غير مزعجة:
- سطر واحد لكل إطار زمني، على سبيل المثال:
M15 | UP | Score: 63 | RSI: 61.2 - مرمّز بالألوان:
-
- الأخضر للصعود
- الأحمر للهبوط
- الذهبي للاستقرار
- يمكن وضع اللوحة في الزاوية العلوية اليسرى أو العلوية اليمنى
- لوحة قابلة للتعديل:
-
- لون الخلفية وشفافيتها
- حجم الخط
- ارتفاع السطر
- ألوان التحيز الصعودي / الهبوطي / المحايد
مثالي للمتداولين السريعين، ومتداولي اليوم، ومتداولي التأرجح الذين يرغبون في تأكيد الصورة الأكبر بسرعة.
🧭 خط التحيز التداولي العالمي
في أسفل اللوحة، ماسح الاتجاه متعدد الأطر الزمنية يحسب متوسط النقاط لجميع الأطر الزمنية النشطة ويحوّله إلى تحيز عالمي واضح:
- ✅ شراء قوي – توافق صعودي قوي عبر الأطر الزمنية
- ✅ شراء – تحيز صعودي، لكنه ليس متطرفًا
- ⚪ محايد – سوق مختلط أو متقلب
- ❌ بيع – تحيز هبوطي
- ❌ بيع قوي – توافق هبوطي قوي
هذا يجعله مثاليًا كـ مرشح للاتجاه والاتجاه لـ:
- التداول اليدوي (التداول فقط في اتجاه التحيز)
- دخولات السكالبينج مع تأكيد من إطار زمني أعلى
- التداول التأرجحي المتوافق مع H1 / H4 / D1
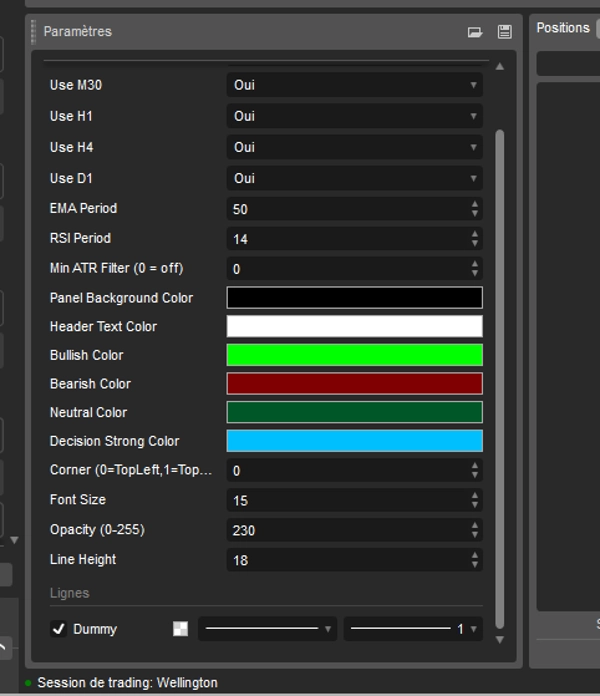
🔧 قابل للتخصيص بالكامل
تحافظ على السيطرة الكاملة على المنطق والمظهر:
- تفعيل/تعطيل كل إطار زمني (M5، M15، M30، H1، H4، D1)
- تكوين:
-
- فترة EMA (حساسية الاتجاه)
- فترة RSI (سلوك الزخم)
- مرشح الحد الأدنى لـ ATR (0 = إيقاف)
- الإعدادات المرئية:
-
- لون خلفية اللوحة وشفافيتها
- ألوان نص الرأس والسطر
- ألوان التحيز الصعودي / الهبوطي / المحايد / القوي
- حجم الخط وتباعد الأسطر
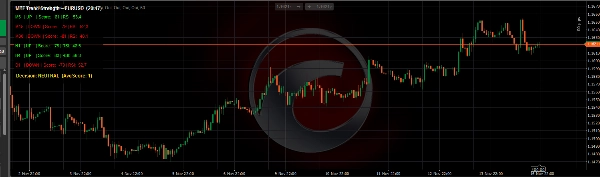
يعمل المؤشر على أي رمز تدعمه cTrader: الفوركس، المؤشرات، الذهب، العملات الرقمية، الأسهم.
إذا كنت تريد طريقة واضحة وموضوعية وبصرية لقراءة توافق الاتجاه عبر أطر زمنية متعددة واتخاذ قرار سريع بشأن ما إذا كان السوق مناسبًا أكثر للشراء أو البيع أو البقاء على الهامش، ماسح الاتجاه متعدد الأطر الزمنية هو إضافة قوية إلى صندوق أدوات cTrader الخاص بك.
الملخص
The indicator displays a compact, color-coded dashboard on the chart, showing one line per timeframe with trend status, score, and RSI value. Users can customize the panel’s position, colors, font size, and which timeframes to include. A global trading bias line at the bottom summarizes the average score across timeframes into five bias states: Strong BUY, BUY, NEUTRAL, SELL, and Strong SELL. This feature supports manual trading, scalping, and swing trading by providing clear directional guidance.
Multi Timeframe Trend Scanner works on any cTrader-supported symbol, including forex, indices, commodities, cryptocurrencies, and stocks. It is designed to help traders quickly assess trend alignment and market bias in a single, easy-to-read interface.
تقييمات العملاء
5 | 100 % | |
4 | 0 % | |
3 | 0 % | |
2 | 0 % | |
1 | 0 % |