説明
https://chartshots.spotware.com/c/695bec6c74055
https://chartshots.spotware.com/c/695bed35bf7b7
https://chartshots.spotware.com/c/695bed6b139df
https://chartshots.spotware.com/c/695bed8ea6bdb
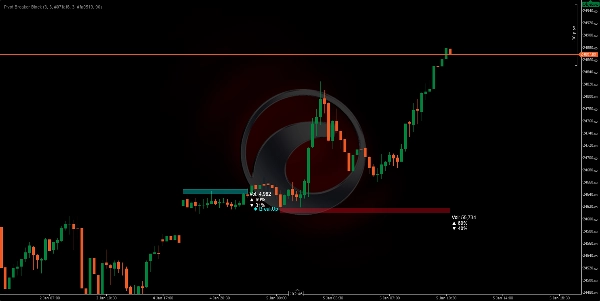
📊 ピボットブレーカーブロック
🤔
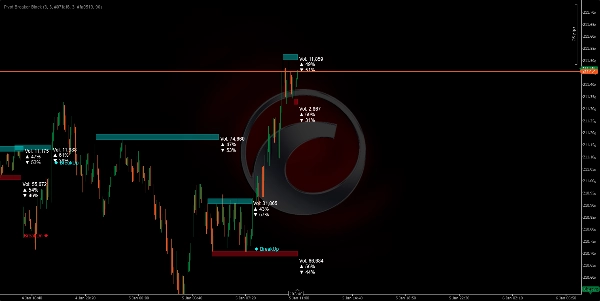
ピボットブレーカーブロックは、視覚的なインジケーターで、重要な価格の転換点(局所的な高値と安値)を自動的に識別し、これらの重要なレベルの周りに「価格ブロック」を構築します。価格がこれらの類似レベルに再び近づくと、アルゴリズムは矩形(ゾーン)を描画し、抵抗(供給)および支持(需要)のエリアを表します。
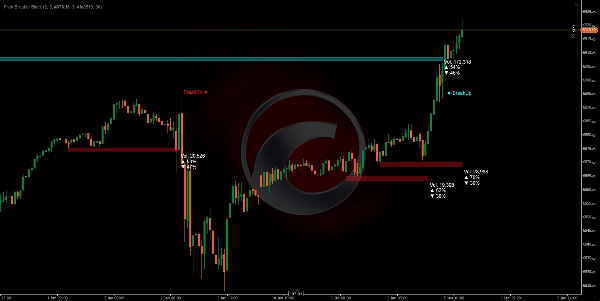
システムは価格がこれらのゾーンを突破するかどうかを継続的に監視し、明確な視覚的シグナルを生成します: BreakUp(強気のブレイクアウト)🔼 または BreakDn(弱気のブレイクアウト)🔽。
何のために使うのか? 🎯
1. 市場支配ゾーンの特定 🗺️
アルゴリズムは価格が強い抵抗(売りの天井)または支持(買いの床)を示した場所を検出します。これらのレベルが複数回現れると、市場はその重要性を確認します。
2. ボリュームの蓄積と分布の視覚化 ⚖️
各ブロックは以下を示します:
- そのゾーンで処理された総ボリューム
- 買いの割合(強気のローソク足)📈
- 売りの割合(弱気のローソク足)📉
これにより、そのエリア内で市場が買いか売りかを確認でき、市場の意図を明らかにします。
3. ブレイクアウトポイントの予測 🚨
価格がこれらのゾーンに近づくと、重要な動きが起こる可能性が最も高いです。アルゴリズムは価格がそれらを突破した時を自動的に検出し、リアルタイムで警告します。
ロジックの仕組み ⚙️
フェーズ1:ピボット検出(転換点) 🔍
アルゴリズムは特定の基準を満たす高値と安値を探します:
- ピボット高値: その高値が直前の5本のローソク足および直後の5本のローソク足よりも高いローソク足。
- ピボット安値: その安値が直前の5本のローソク足および直後の5本のローソク足よりも低いローソク足。
この「5」というパラメータ(ピボットの振り返り期間)は、ボラティリティに応じて調整可能です。
フェーズ2:コントロールゾーン認識 🎯
ピボットが特定されると、システムは同じタイプの前のピボットと比較します。両者の差がATRの20%未満(現在のボラティリティの指標)であれば、市場は以前に拒否された類似レベルを再訪していることを意味します。
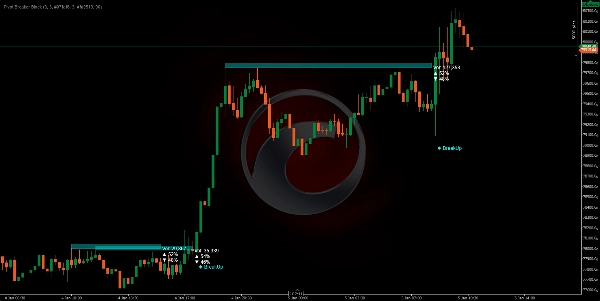
フェーズ3:ゾーンサイズ設定 📏
各ブロックの高さは、ATR(平均真の範囲)を使って動的に計算されます:
- 供給(赤): ピボットの上にATR × 0.5ポイントの天井。
- 需要(シアン): ピボットの下にATR × 0.5ポイントの床。
これはゾーンが資産のボラティリティに自動的に適応することを意味します。ボラティリティが高い市場ではゾーンは広く、穏やかな市場では狭くなります。
フェーズ4:リアルタイムボリューム分析 💹
価格がゾーン内にある間、アルゴリズムはブロック開始以来の買いと売りのボリュームを合計します:
- 買い: 終値が始値より高いローソク足(強気のボリューム)。
- 売り: 終値が始値より低いローソク足(弱気のボリューム)。
これらの割合は、そのゾーン内での支配的な意図を示します。
フェーズ5:ブレイクアウト検出 🚀
アルゴリズムは新しいローソク足ごとに監視します:
- BreakUp (↑): 終値が供給の天井を上回る→ 強気のブレイクアウトシグナル。
- BreakDn (↓): 終値が需要の床を下回る→ 弱気のブレイクアウトシグナル。
これが起こると、ブロックは非アクティブになり、画面上にテキストシグナルが表示されます。
使い方 🛠️
インストールと設定 ⚙️
- cTraderプラットフォームにインジケーターを追加します。
- 調整可能なパラメータにアクセスします:
パラメータ 意味 推奨値
ピボット振り返り期間
ピボットを確認するために左右何本のローソク足を評価するか
5 (標準)、高い時間足では増やす
供給ゾーン係数
赤いブロック(抵抗)の高さ
5.0 (標準)、好みに応じて調整
需要ゾーン係数
シアンのブロック(支持)の高さ
5.0 (標準)、好みに応じて調整
透明度
ブロックの不透明度(0=見えない、255=不透明)
90 (視認性のため推奨)
色
視覚的な外観をカスタマイズ
供給は赤、需要はシアン
トレーディング戦略 💡
シナリオ1:ロングエントリー(買い) 📈
- 価格が需要ブロック(シアン)を形成し、買いの割合が55%超になるのを待ちます。
- BreakUpが見えたら、強気のエントリーを確認します。
- ストップロス(SL)はブロックの床の下に設定します。
シナリオ2:ショートエントリー(売り) 📉
- 供給ブロック(赤)を探し、売りの割合が55%超であることを確認します。
- BreakDnで弱気のポジションを開きます。
- ストップロス(SL)はブロックの天井の上に設定します。
シナリオ3:反転(平均回帰) 🔄
- 価格が需要ブロック内にあるが、買いの割合が低い(45%未満)場合…
- 価格がBreakUpに達することなく反発して上昇すると予想します。
- 床近くで買いエントリーし、利確(TP)は天井に設定します。
最適な時間足 ⏰
- H4/D1: より重要なブロック、長期の動き。
- H1: ノイズとチャンスのバランスが良い。
- M15: 迅速なエントリー、ボリューム確認が必要。
概要
The indicator continuously monitors price action relative to these zones, providing real-time breakout signals: "BreakUp" for bullish breakouts above resistance and "BreakDn" for bearish breakouts below support. Each block displays cumulative volume data, including total volume processed and the percentage of buying (bullish) versus selling (bearish) activity, helping traders assess market intention within these areas.
Pivot Breaker Block supports multiple trading strategies, including breakout entries and mean reversion, with configurable parameters such as pivot lookback period, zone height factors, and visual transparency. It is suitable for various markets including Forex, indices, commodities, stocks, and cryptocurrencies, and works effectively on timeframes from 15 minutes to daily charts.
Key features:
- Automatic pivot detection with adjustable lookback
- Dynamic supply and demand zone sizing based on ATR
- Real-time volume accumulation and buy/sell ratio visualization
- Breakout alerts with on-screen signals
- Supports multiple asset classes and timeframes for versatile use