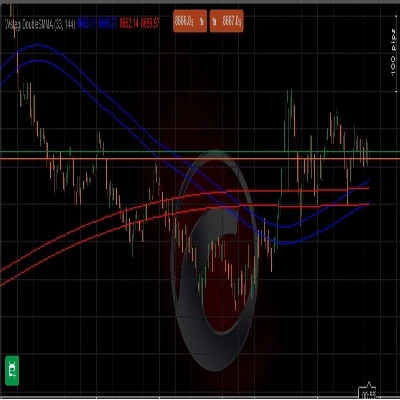
ブローカー&プロップファーム
事業者向け
00
Days
:
00
Hours
:
00
Minutes
:
00
Seconds
Wstęgi DoubleSMMA
「Wstęgi DoubleSMMA」ロゴ
登録日 16/05/2025
無料インストール
64

Wstęgi HTS SMMA 33 144

0.0
レビュー: 0
カスタマーレビュー
この商品にはまだレビューがありません。お使いになったことがある方は、ぜひレビューをお願いします。
この作成者の他の商品
smma tel
Wstęgi HTS 33 144 mobile
これも好きかも
Lozano Price Action
LPA simplifies trading by coloring candles with volume data and RSI levels for trend and reversal insights.
インジケーター
NAS100
NZDUSD
Martingale
+26
OHLC PRO by LudwigICT
OHLC PRO – Advanced Session & Market Structure Tool
インジケーター
Grid
NAS100
RSI
+19
Delta-RSI Candle Pro
Delta RSI Candle Pro
Scalper Signal MTF
This code is a custom scalping indicator for the cTrader platform.
VegaXLR - cTrader Multi-Timeframe Pivot Pro
Customizable multi-timeframe pivot point indicator for cTrader with alerts, Fibonacci, CPR, and more!
インジケーター
Indices
Prop
Commodities
+3
LT_Ind_TradeNet
Personal trade tracker for a single symbol. Clear net profit summary — FreshNet, ManageNet, DayNet, WTDNet, MTDNet.
インジケーター
Grid
NAS100
NZDUSD
+15
EMA UP&DOWN 2025
SectorIndex Dual Moving Average Indicator: Your Market Compass 🧭
インジケーター
Breakout
Forex
Signal
+2
MACD Plus
A visually enhanced MACD with colored histograms to clearly show trend strength.
Cumulative Delta_noSourceCode
Demo of my main indcator.
Supply Demand Premium V2_NSC
The long awaited new and improved Supply Demand Premium V2 indicator. Unlock greater trading opportunities now!
インジケーター
Forex
Signal
MACD
swingh6
Swing-Trading Indicaotr for pairs like EUR/USD, AUD/USD, and USD/JPY. Most effective on higher time frames H4,H6,H12...
MultiTimeFrameTrend
A compact, visual multi-timeframe trend indicator for cTrader. Easily spot bullish or bearish trends across 4 customizab
Tradingview Economic Calendar onn Chart
Customizable window inside your platform, access to any website Calendar
IR CheckList
you could put your check list in your chart you could split your test with “,” you could put your checklist in indicat
インジケーター
Indices
Stocks
Commodities
+2
Custom Timeframes
Custom and native timeframes display with OHLC lines, moving averages, and Fibonacci levels.
Previous Day Equilibrium (Premium & Discount)
Plots the equilibrium price levels based on previous daily highs and lows.
インジケーター
NAS100
RSI
NZDUSD
+13
RSI
RSI Pro Tool – Overbought & Oversold Made Easy