
STC
Индикатор
278 скачивания
Версия 1.0, Jan 2025
Windows, Mac
5.0
Отзывы: 2
Описание
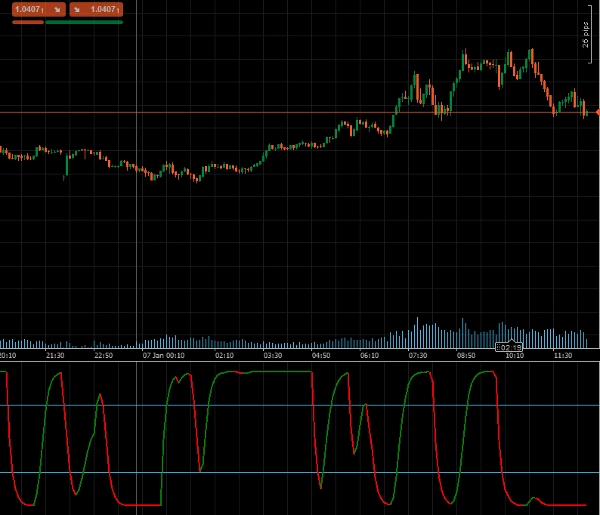
The Schaff Trend Cycle (STC), разработанный известным техническим аналитиком Doug Schaff, представляет собой продвинутый торговый индикатор, предназначенный для определения рыночных трендов и разворотов с исключительной скоростью и точностью. Основанный на инновационной идее сочетания компонентов тренда и цикла, STC использует экспоненциальные скользящие средние (EMA) и стохастические вычисления для преодоления ограничений запаздывающих индикаторов, таких как MACD или Стохастик. Этот уникальный подход обеспечивает более ранние и надежные торговые сигналы, предоставляя значительное преимущество в обнаружении трендов и анализе рынка.
Ключевые особенности:
- Раннее обнаружение тренда: Сочетает экспоненциальные скользящие средние (EMA) с стохастическими вычислениями для более быстрого захвата трендов.
- Настраиваемые параметры: Регулируйте длину, быструю MA, медленную MA, тип MA и фактор сглаживания в соответствии с вашей торговой стратегией.
- Визуальные оповещения: Динамические изменения цвета указывают на бычьи или медвежьи тренды, облегчая интерпретацию рыночных условий.
- Поддержка уровней перекупленности/перепроданности: Встроенные уровни (25 и 75) помогают выявлять потенциальные точки разворота рынка.
Параметры
- Длина: Определяет количество периодов для расчета тренда.
- Длина быстрой MA: Устанавливает длину быстрой скользящей средней.
- Длина медленной MA: Задает длину медленной скользящей средней.
- Тип MA: Позволяет выбрать тип скользящей средней (например, EMA, SMA).
- Фактор сглаживания: Регулирует фактор сглаживания для более точных сигналов тренда.
Выходные данные
- STC: Выводит основное значение Schaff Trend Cycle, представляющее направление и силу тренда, для программного использования в автоматизированных торговых системах.
- STCBull: Подчеркивает условия бычьего тренда.
- STCBear: Подчеркивает условия медвежьего тренда.
Сводка
Профиль индикатора
Отзывы покупателей
5.0
Отзывы: 2
5 | 100 % | |
4 | 0 % | |
3 | 0 % | |
2 | 0 % | |
1 | 0 % |
Отзывы покупателей
August 12, 2025
Pros: Fast and accurate trend detection, earlier signals than MACD, customizable levels. Cons: No alerts, no MTF mode, no trade statistics.
Обсуждение
Частые вопросы
MACD
Продукты, доступные в cTrader Store, включая торговых ботов, индикаторы и плагины, предоставляются сторонними разработчиками и доступны исключительно в информационных и технических целях. cTrader Store не является брокером и не предоставляет инвестиционные консультации, персональные рекомендации или какие-либо гарантии будущей доходности.
Больше от этого автора


![Логотип продукта "High-Low Divergence [Iridio Capital]"](https://cdn.ctrader.com/image/webp/443c4661-7abb-40f1-842f-4b6ec560649b_40914)


Цена
С 24/09/2024
4.47K
Бесплатные установки