
Описание
Концепция "Обратного Инжиниринга"
Главное новшество этого индикатора заключается в его алгоритме обратного инжиниринга. Обычно стохастический осциллятор берет данные о цене и преобразует их в число от 0 до 100. Этот индикатор делает наоборот: он берет математические уровни осциллятора и проецирует их обратно на шкалу цены.
Это позволяет трейдеру перевести математический импульс в конкретный уровень цены (в $ или пипсах) непосредственно на графике.
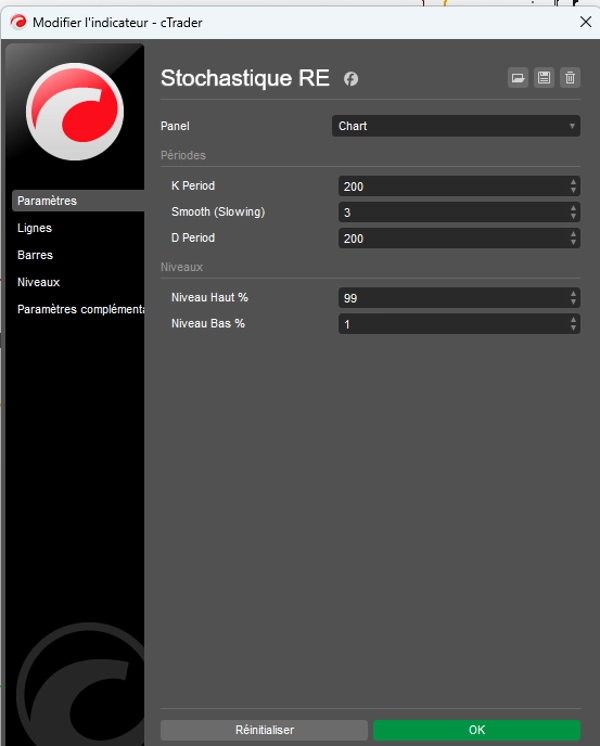
Определение границ: потолок (99%) и пол (1%)
В отличие от классических настроек (80/20), этот индикатор по умолчанию установлен на 1% и 99%. Эта конфигурация имеет конкретную цель: она определяет физические пределы цены.
- Уровень 99% (потолок цены): Он определяет максимальную цену, которую рынок может достичь, прежде чем будет считаться, что он исчерпал 99% амплитуды своего движения за данный период. Это "граница" цены.
- Уровень 1% (пол цены): Он определяет минимальную цену, окончательную поддержку текущего цикла. Это уровень, на котором цена исчерпала 99% своей нисходящей способности относительно своей недавней истории.
Почему это "определяет цену"?
Благодаря этой системе оранжевая линия сигнала %D больше не просто кривая, движущаяся в вакууме.
- Локализация цены: Она показывает точное расположение "справедливой цены", взвешенной по ее импульсу.
- Картирование диапазона: Она превращает график в карту, на которой видно, стоит ли текущая цена "1%" или "99%" от своего потенциала.
- Конкретные цели: Если оранжевая линия поднимается, она не просто стремится достичь "80"; она стремится достичь точной цены, отображаемой красной линией (99%).
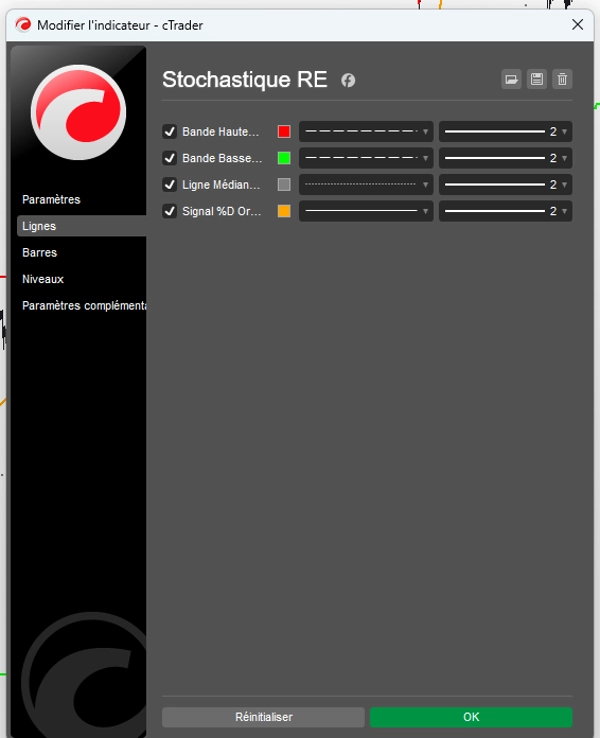
Функции линий (вкладка Линии)
Все настраивается для мгновенного визуального восприятия:
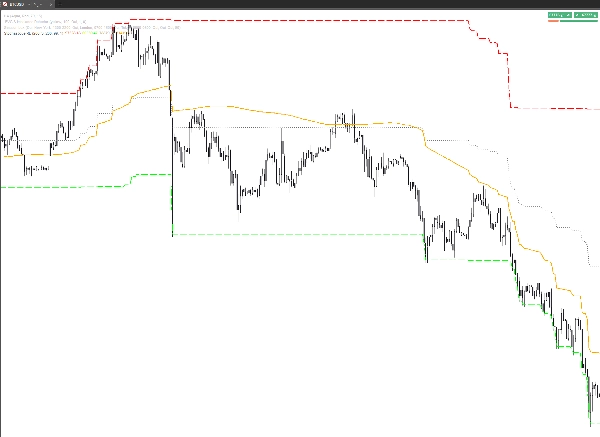
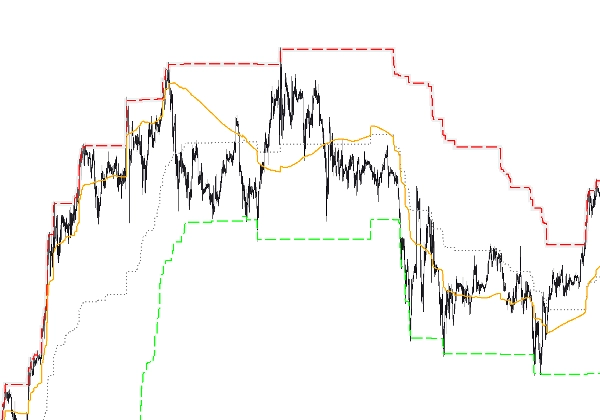
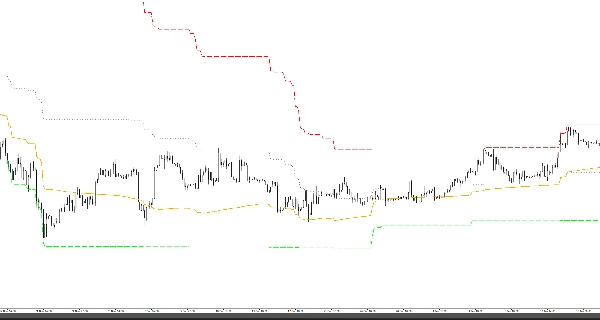
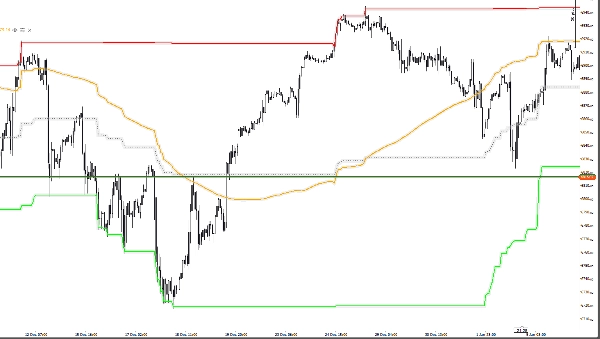
- Верхняя граница (99%): Теоретический потолок цены.
- Нижняя граница (1%): Теоретический пол цены.
- Средняя линия (50%): Центральная точка опоры, зона равновесия.
- Оранжевый сигнал %D: Динамический курсор, перемещающийся между полом и потолком для определения направления рынка.
Резюме для трейдера
Этот индикатор не просто говорит вам, что рынок "перекуплен"; он показывает точно по какой цене рынок становится физически слишком дорогим (99%) или слишком дешевым (1%). Это точный инструмент, который возвращает математику к реальности книги ордеров.
Сводка
The indicator displays these boundaries directly on the price chart, allowing traders to see exact price levels where the market is considered overbought or oversold. Key features include customizable lines for the upper band (99%), lower band (1%), mid line (50%), and an orange signal %D line that dynamically indicates market direction between these boundaries.
By translating momentum into precise price targets, Stochastique RE helps traders localize fair price zones, map price ranges, and identify concrete price targets rather than abstract oscillator values. It supports various markets including Forex, stocks, commodities, indices, and cryptocurrencies, with symbol tags such as BTCUSD, EURUSD, GBPUSD, XAUUSD, NAS100, and USDJPY.
Отзывы покупателей
5 | 67 % | |
4 | 33 % | |
3 | 0 % | |
2 | 0 % | |
1 | 0 % |


![Логотип продукта "[CB] Pivot Points Pro"](https://cdn.ctrader.com/image/webp/43463c82-67b0-4f10-a4ba-901bba091d81_32594)


