Описание
Забудьте о перегруженных индикаторах объемного профиля, которые загромождают ваш график ненужной графикой и потребляют чрезмерные системные ресурсы.
За эти годы я использовал множество различных индикаторов VP и потратил на них значительную сумму денег. Ни один из них не обеспечил баланс простоты и качества, который я искал, поэтому я решил создать свой собственный подход.
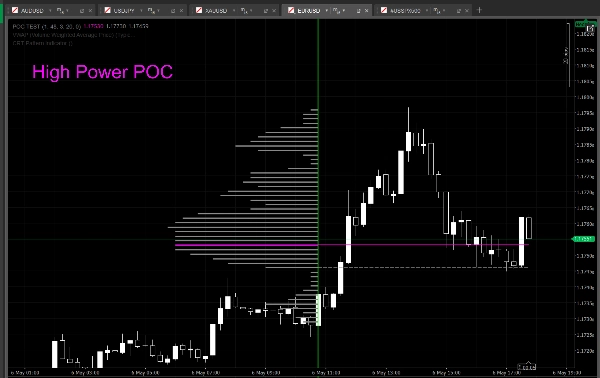
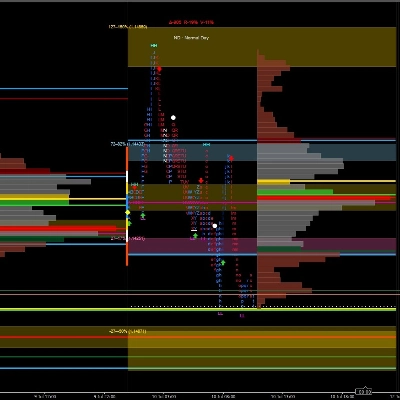
Когда вы добавляете индикатор на график, появляется только одна вертикальная линия. Эта линия представляет свечу, с которой начинается расчет. Максимумы / минимумы после выбранной свечи автоматически определяются индикатором и используются для динамического определения границ диапазона профиля. Гистограмма вместе с уровнями POC / VAH / VAL создается мгновенно.
Ваша единственная задача — перетащить стартовую линию на нужную свечу и, при необходимости, задать ограничение Duration Minute в настройках ввода. Поскольку линия притягивается к свечам как магнит, неправильное выравнивание или случайное неправильное использование практически невозможно.
Просто как это.
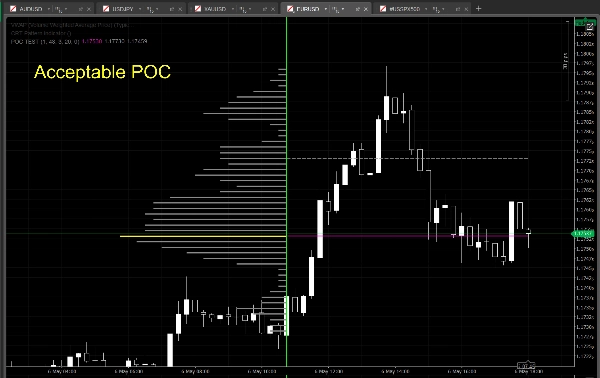
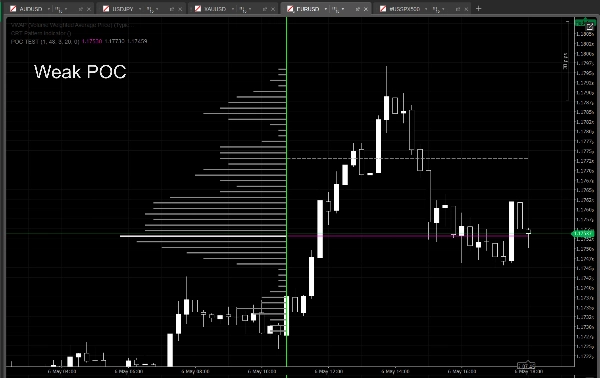
Линия гистограммы, соответствующая POC, использует 3 разных цвета для отображения силы POC:
- Белый → Слабый POC
- Желтый → Приемлемый / сбалансированный POC
- Магента → Сильный POC
Важное замечание:
Свеча, на которую установлена стартовая линия, НЕ включается в расчет. Профиль начинается со следующей свечи после выбранной.
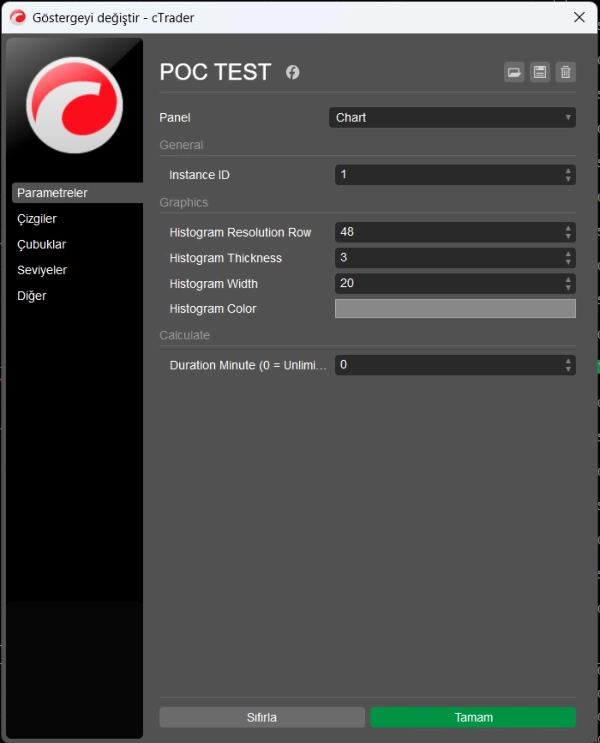
Вы можете создавать несколько независимых профилей на одном графике, используя разные значения Instance ID.
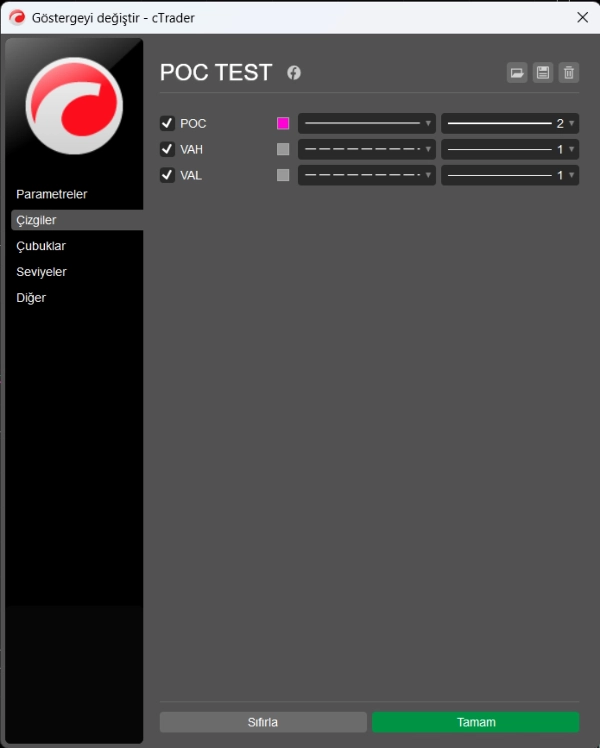
Структура параметров была намеренно упрощена. Вместо десятков ненужных настроек включены только основные элементы управления. Несмотря на чистый внешний вид, индикатор запускает высокоточный расчетный движок в фоновом режиме.
Некоторые методы расчета, используемые внутри:
- Гибридное распределение взвешенного объема
- Расчет смещения по цене закрытия
- Взвешивание тела свечи
- Логика фильтрации свипов / фитилей
- Обнаружение POC на основе кластеров
- Анализ динамической силы POC
- Адаптивное расширение зоны стоимости
- Стабилизированный расчет VAH / VAL
- Генерация гистограммы с уменьшением шума
- Низконагрузочный пересчет в реальном времени
Примечание:
- Для простоты и стабильности набор параметров был намеренно ограничен. Пользователи, которым нужны более продвинутые возможности настройки, могут связаться со мной напрямую. Для них в будущем может быть выпущена отдельная расширенная версия.
Сводка
Users can drag the start line to select the desired candle, with an optional duration limit setting. The line snaps to candles to prevent misalignment. Multiple independent profiles can be created on the same chart using different instance IDs.
The POC line uses three colors to indicate strength: white for weak, yellow for balanced, and magenta for strong POC. Internally, the indicator employs advanced calculation methods including hybrid weighted volume distribution, close-price bias, candle body weighting, wick filtering, cluster-based POC detection, dynamic POC strength analysis, adaptive value area expansion, stabilized VAH/VAL calculation, noise-reduced histogram generation, and low-overhead real-time recalculation.
The parameter set is minimal, focusing on essential controls to maintain a clean chart appearance without excessive resource consumption. This indicator supports visualization of volume profiles with key market structure levels for enhanced volume-based analysis.


![Логотип продукта "Wyckoff Toolkit [Iridio Capital]"](https://cdn.ctrader.com/image/webp/8acfe6a1-6a8e-4578-9367-9df3af2b1801_27763)