Описание
HAI Quantum V10 — это продвинутый индикатор, предназначенный для технического анализа финансовых активов, особенно эффективный на волатильных рынках. Его архитектура сочетает алгоритмический интеллект с паттернами поведения цены, позволяя трейдерам выявлять зоны с высокой вероятностью для входа и выхода.
🔥 Специальное предложение к возвращению на рынок – ограниченное по времени!
Праздники закончились, и пора возвращаться к делу. По мере пробуждения рынков должна проснуться и ваша стратегия.
В честь возвращения к работе я предлагаю свой самый мощный торговый инструмент — HAI Quantum V10 — всего за 49 долларов.
Это ограниченное по времени предложение, предназначенное для серьезных трейдеров, которые хотят начать сезон с сильной позиции. Независимо от того, совершенствуете ли вы свое преимущество или ищете надежную систему, это ваш шанс получить проверенный индикатор по специальной цене.
✅ Создан для золота (XAUUSD) ✅ Проверен на нескольких таймфреймах ✅ Разработан трейдером для трейдеров
Не ждите — это предложение не продлится долго. Вернитесь в игру с уверенностью и точностью.
Наш продукт интегрирует набор ключевых индикаторов, чтобы дать вам всестороннее представление о рынке:
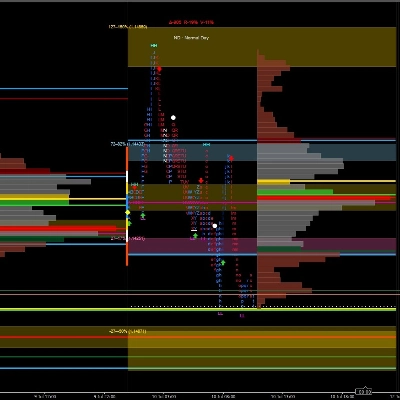
- Range Box Fibonacci (наша собственная разработка): Уникальный инструмент, который помогает определить потенциальные зоны поддержки и сопротивления на основе уровней Фибоначчи.
- Ключевые опорные цены: Мы определяем важнейшие ценовые точки на основе пересечения трех настраиваемых индикаторов (CCI, Stochastic, RSI). Эти точки помогут вам выявлять возможности для входа и выхода.
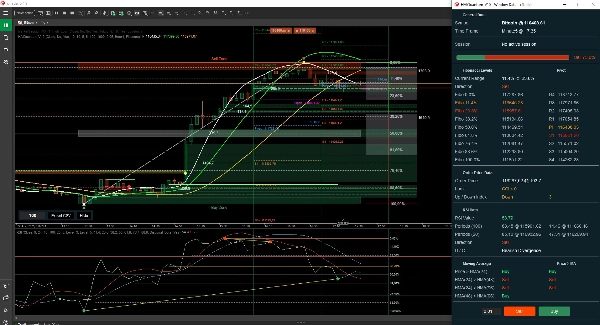
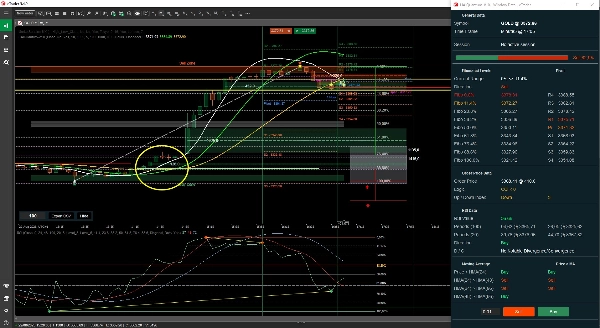
- Три настраиваемых скользящих средних: Выбирайте скользящие средние, которые лучше всего подходят вашей стратегии, чтобы подтверждать тренды и обнаруживать изменения направления цены.
- RSI: Для более точного прогнозирования движения цены. С высокими и низкими значениями за выбранные периоды. Не включен в визуализацию.
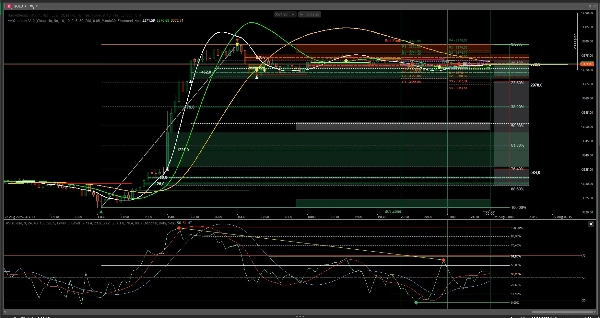
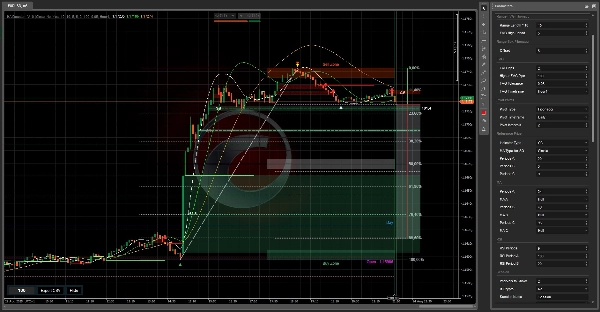
HAI Quantum собирает и обрабатывает данные этих индикаторов, предлагая вам два способа визуализации:
- Ручной режим: Четкое и лаконичное окно, суммирующее, движется ли цена вверх или вниз согласно каждой конфигурации индикатора.
- Новое окно данных с выделенными уровнями Фибоначчи и Pivot: В этой новой версии мы интегрировали FVG (Fair Value Gap), который можно фильтровать по размеру и близости к уровню Фибоначчи или Pivot, а также по точкам их смягчения, как показано на изображении.
Сводка
Отзывы покупателей
5 | 100 % | |
4 | 0 % | |
3 | 0 % | |
2 | 0 % | |
1 | 0 % |