
FinTracker
مؤشر
14 التنزيلات
الإصدار 1.0، May 2026
Windows, Mac
5.0
التقييمات: 1
منذ 21/02/2025
466.3M
حجم التداول
180.83K
الربح بالبيب
26
المبيعات
7.43K
التثبيتات المجانية
الوصف
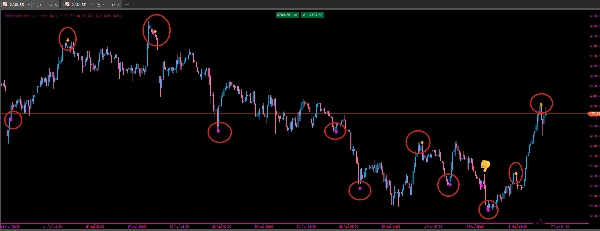
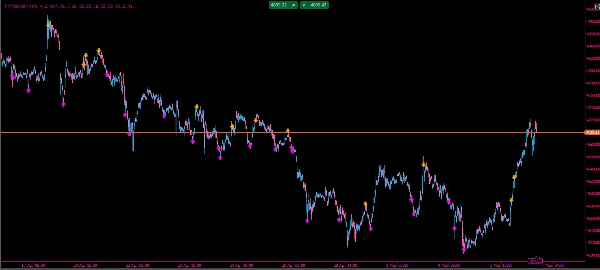
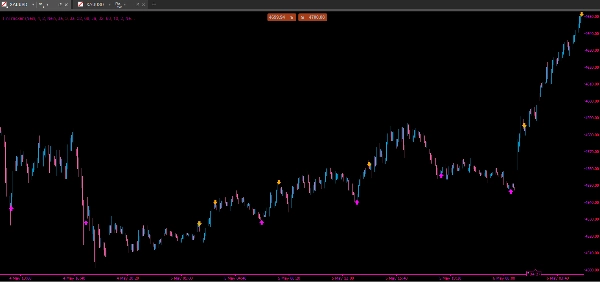
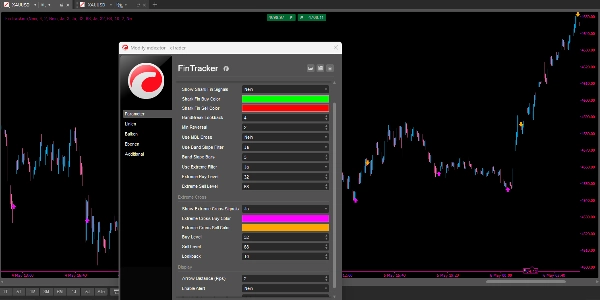
يجمع هذا المؤشر بين المنطق الأساسي لـ مؤشر ديناميكية المتداولين (TDI) مع التعرف المتقدم على الأنماط لإشارات "زعانف القرش" و"التقاطع الشديد". يتتبع تقلبات السوق من خلال نطاقات مخصصة على نمط بولينجر مطبقة على مؤشر القوة النسبية (RSI)، ويحدد نقاط الانعكاس ذات الاحتمالية العالية عندما يخترق خط RSI هذه المناطق المتقلبة ثم يعود إليها.
الميزات الرئيسية
- المنطق الأساسي لـ TDI: يستخدم مؤشر القوة النسبية بفترة 10 مع نطاقات تقلب ديناميكية لتصور معنويات السوق وقوته.
- كشف زعنفة القرش: يحدد "الارتفاعات" السريعة حيث يخرج مؤشر القوة النسبية من النطاقات وينعكس بسرعة، مشيراً إلى نقطة احتمال نفاد القوة.
- إشارات التقاطع الشديد: يشير إلى التقاطعات التي تحدث عند مستويات التشبع الشرائي أو البيعي (مثلاً، فوق 68 أو تحت 32).
- تصفية متعددة الطبقات: تشمل فلاتر اختيارية لانحدار النطاق و"خط الأساس السوقي" (MBL) لتقليل الضوضاء.
- تنبيهات في الوقت الحقيقي: أسهم بصرية مدمجة على الرسم البياني، تسجيل في وحدة التحكم، وإشعارات منبثقة اختيارية للتداول الحي.
لزيادة معدل الفوز لمؤشر FinTracker، يُنصح بشدة بمشاهدة الإشارات من خلال عدسة هيكل السوق بدلاً من تداولها بشكل منفرد. فيما يلي التوصيات المهنية للتنفيذ الفعال:
التوصيات الاستراتيجية
- توافق الإطار الزمني العالي (HTF): قم دائماً بمحاذاة تداولاتك مع الاتجاه السائد. إذا كان الرسم البياني H4 صاعداً، ففضل إشارات شراء زعنفة القرش على الرسوم البيانية M15 أو H1. التداول ضد اتجاه HTF يزيد بشكل كبير من خطر الوقف.
- تصفية خط الأساس السوقي (MBL): استخدم خط MBL الأصفر (الخط المركزي) كبوابة "الزخم". يكون شراء زعنفة القرش أقوى بكثير إذا عبر مؤشر القوة النسبية بعد ذلك فوق MBL، مؤكداً عودة الزخم الصاعد فعلياً.
- الوعي بالتقلبات: تكون زعانف القرش أكثر موثوقية عندما تتوسع نطاقات التقلب. في حالة "الضغط" (نطاقات ضيقة)، يكون السوق غالباً محصوراً في نطاق، مما يؤدي إلى اختراقات كاذبة. انتظر اختراقاً واضحاً لنطاق واسع للحصول على أفضل النتائج.
- التحقق من التباعد: ابحث عن "التباعد المخفي" لاستمرار الاتجاه أو "التباعد العادي" للانعكاسات. إذا صنع السعر قاعاً أدنى لكن FinTracker شكل شراء زعنفة قرش أعلى، فإن احتمال الانعكاس يكون مرتفعاً جداً.
- إدارة المخاطر: ضع وقف الخسارة قليلاً خارج أعلى أو أدنى حركة سعر حديثة ناتجة عن "الارتفاع" في زعنفة القرش. استهدف نسبة مخاطرة إلى مكافأة لا تقل عن 1:2، وقم بتحريك وقف الخسارة بمجرد عبور مؤشر القوة النسبية لـ MBL.
الملخص
AI summary
FinTracker is a technical indicator that enhances the Traders Dynamic Index (TDI) by integrating advanced pattern recognition to identify rapid market reversals. It applies custom Bollinger-style volatility bands to a 10-period RSI, detecting key signals such as "Shark Fin" spikes—where the RSI breaks out of and quickly re-enters volatility bands—and "Extreme Cross" events, which are RSI crossovers occurring at overbought or oversold levels (above 68 or below 32). The indicator includes multi-layer filtering options, such as band slope and Market Base Line (MBL) crosses, to reduce noise and improve signal quality. Real-time alerts are provided via chart arrows, console logs, and optional pop-up notifications. For effective use, it is recommended to align signals with higher time frame trends, use the MBL as a momentum confirmation tool, consider volatility band expansion for reliability, and validate signals with divergence analysis. Risk management guidelines suggest placing stop losses beyond recent swing highs or lows and targeting a minimum risk-to-reward ratio of 1:2. FinTracker supports spotting key reversal points through momentum and volatility analysis, aiding traders in timing entries within the context of market structure.
ملف تعريف المؤشر
فئة المؤشر
الدعم والمقاومة
نوع المخرجات
الإشارات
متطلبات البيانات
أعمدة السعر فقط
الإشارات المدعومة
التباين
الانعكاس
تقييمات العملاء
5.0
التقييمات: 1
5 | 100 % | |
4 | 0 % | |
3 | 0 % | |
2 | 0 % | |
1 | 0 % |
تقييمات العملاء
May 27, 2026
One of the best indicator I've used so far I've tried dozens of indicators over the years and this one stands out. It keeps things simple without losing accuracy. Works great across multiple assets — forex, crypto, and indices.
مناقشة
الأسئلة الشائعة
Key Levels
RSI
Liquidity Grab
يتم توفير المنتجات المتاحة من خلال cTrader Store، بما في ذلك روبوتات التداول والمؤشرات والإضافات، من قبل مطوري الطرف الثالث وإتاحتها لأغراض الوصول المعلوماتي والفني فقط. cTrader Store ليس وسيطًا ولا يقدم نصائح استثمارية أو توصيات شخصية أو أي ضمان للأداء المستقبلي.












![شعار "Session Volume Profile (SVP) [Iridio Capital]"](https://cdn.ctrader.com/image/webp/b058beb7-b143-45f3-87d0-8c524c00b203_61552)














السعر
منذ 21/02/2025
466.3M
حجم التداول
180.83K
الربح بالبيب
26
المبيعات
7.43K
التثبيتات المجانية