说明
WHAT DOES IT DO?
--------------------------------------------------------
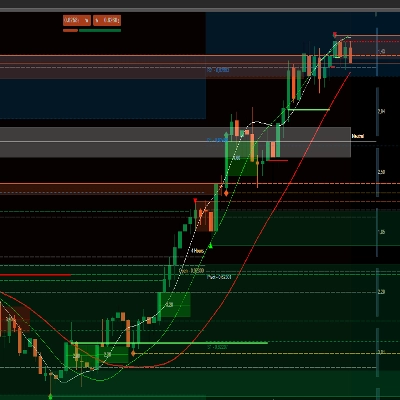
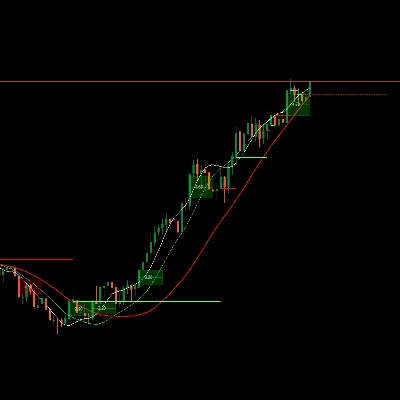
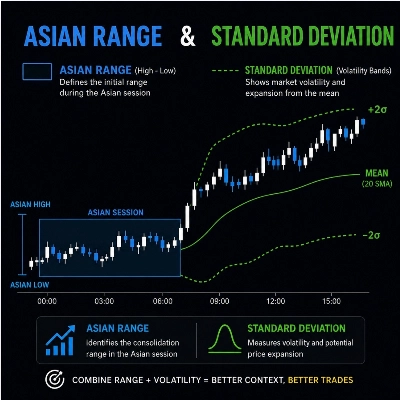
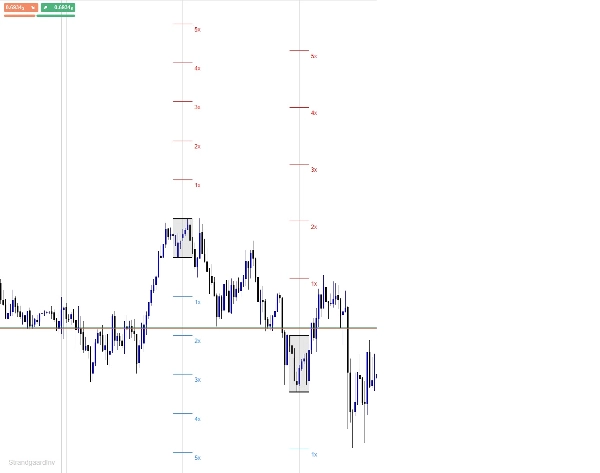
The indicator draws the range from 8PM to 12AM
for each day for a rolling number of days back ("Days Back"),
including today (live).
For each day, it draws:
- A filled box marking the range itself (high/low)
- A horizontal line at the top of the range
- A horizontal line at the bottom of the range
- Standard deviation lines (1x to 5x, number adjustable)
above and below the range, limited to the same time width
as the range itself (not projected to the right)
Everything for a given day is automatically cleared away again when the day
falls outside your chosen "Days Back" window.
--------------------------------------------------------
IMPORTANT: TIME ZONE / DST
----------------------------------------------------------------
The start and end time of the range (default 8 PM - 12 AM)
is entered in YOUR BROKER'S SERVER TIME - not automatically in EST.
The indicator does NOT convert between EST/EDT and your
broker's server time. This means:
1. You have to find out what 20:00-00:00 EST
corresponds to on your broker's server clock (e.g. check a known
news time against your chart).
2. When the USA switches to/from daylight saving time (DST), or if
your broker's server does not follow DST,
the difference changes - then you have to update the Start/End
Hour parameters in the indicator yourself.
Standard Range window: 8:00 PM - 12:00 AM EST.
-----------------------------------------------------
PARAMETERS
----------------------------------------------------------
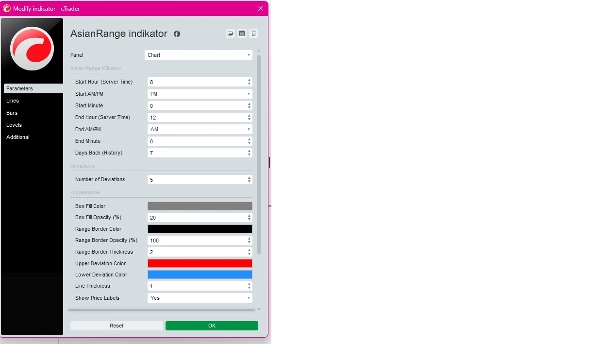
8pm-12am Range Window:
Start Hour / Start AM-PM / Start Minute - start of the range (server time)
End Hour / End AM-PM / End Minute - end of the range (server time)
Days Back (History) - how many days back
are shown (0 = today only)
Deviations:
Number of Deviations - number of SD levels (1-10),
default 5
Appearance:
Box Fill Color / Box Fill Opacity (%) - color and transparency
for the range box itself
Range Border Color / Range Border Opacity - color and transparency
/ Range Border Thickness for the top/bottom lines
Upper Deviation Color - color for SD lines above the range
Lower Deviation Color - color for SD lines below the range
Line Thickness - thickness of SD lines
Show Price Labels - show/hide "1x", "2x" etc.
next to the SD lines
----------------------------------------------------------------------
KNOWN PITCH
------------------------------------------------------
If the top/bottom lines (Range Border Color) are set to a color that matches your chart background (e.g. white line on white background), they will look like they are "not being drawn" - they just lie there invisibly. Default is set to black, which suits a light/white chart theme. Change to a lighter color if you are using a dark theme.
--------------------------------------------------------
INSTALLATION
---------------------------------------------------------
1. Open cTrader -> Automate tab.
2. Create a new Indicator (or open an existing one).
3. Replace the code with the contents of the.cs file
4. Build.
5. Add the indicator to your chart via "Add algorithm".
--------------------------------------------------------