present
Зарегистрируйтесь и получите скидку $50 на первую покупку
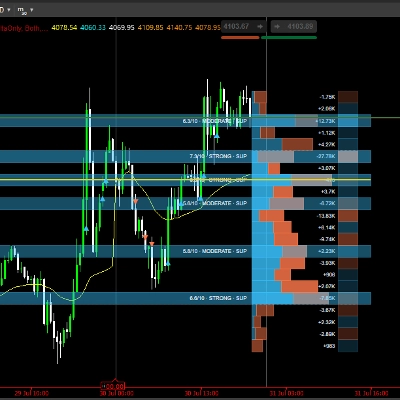
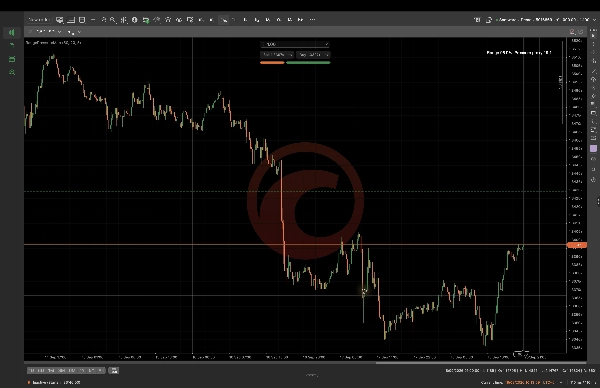
Trading product for Range Pressure Map Индикатор EMA Volume, image 1
Range Pressure Map
Индикатор
Версия 1.0, Sep 2026
Windows, Mac
5.0
Отзывы: 2
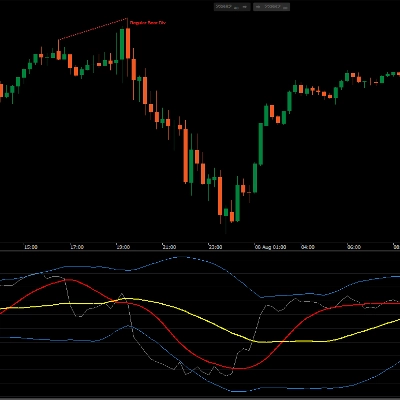
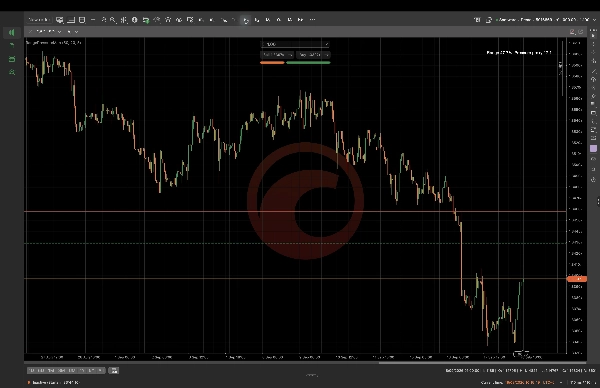
Trading product for Range Pressure Map Индикатор EMA Volume, image 2
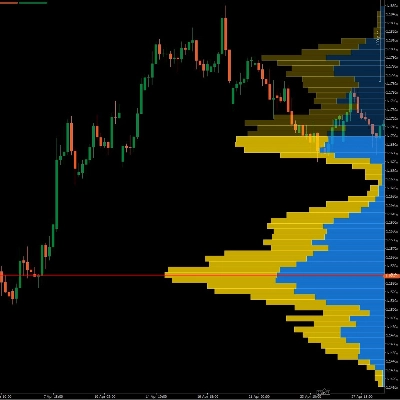
Trading product for Range Pressure Map Индикатор EMA Volume, image 3
Trading product for Range Pressure Map Индикатор EMA Volume, image 4
Trading product for Range Pressure Map Индикатор EMA Volume, image 5
С 16/09/2026

Описание

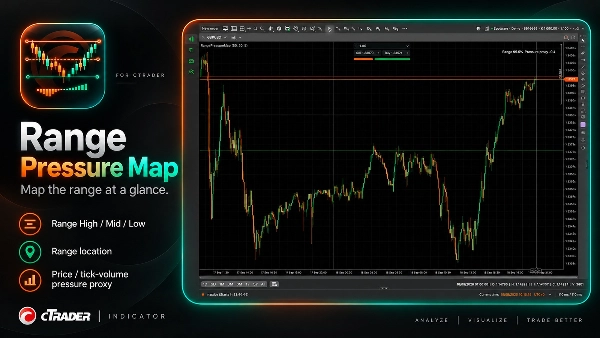
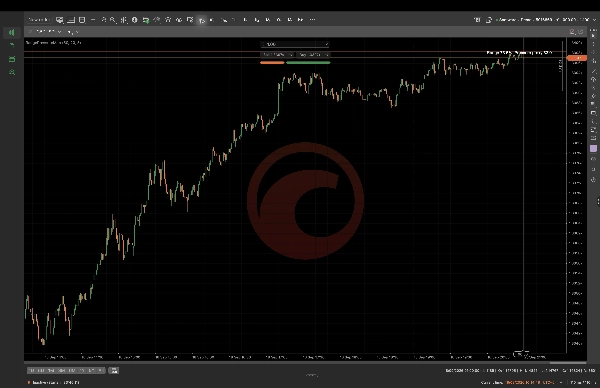
Range Pressure Map рассчитывает диапазон обратного просмотра и отображает Range High, Range Mid и Range Low вместе с текущим расположением цены и детерминированным прокси давления по объему тиков. Настройте диапазон обратного просмотра, обратный просмотр давления и длину EMA, чтобы соответствовать контексту графика, который вы просматриваете. Он предназначен для дискреционного анализа графиков и не представляет собой поток заказов, реальный рыночный объем, активность покупателей или продавцов, прогнозы или автоматическое исполнение сделок. Значения зависят от выбранного символа, таймфрейма, параметров и доступных данных.

Сводка

ИИ-сводка
Range Pressure Map is a cTrader indicator that calculates a lookback range and visually displays the Range High, Range Mid, and Range Low levels on your chart. It also shows the current price location within this range alongside a deterministic tick-volume pressure proxy, which serves as an estimate of market pressure based on tick volume data. Users can customize parameters including range lookback period, pressure lookback, and EMA length to align with their specific chart context. This tool is intended for discretionary chart analysis and does not provide order flow data, real market volume, buyer or seller activity, predictive signals, or automated trade execution. Its outputs depend on the selected trading symbol, timeframe, and input parameters. The indicator supports visualization of support and resistance levels combined with volume-based pressure insights to assist traders in analyzing price action within defined ranges.
Профиль индикатора
Категория индикатора
Поддержка и сопротивление
Тип вывода
Визуализация
Требования к данным
Только бары

Обсуждение

Отзывы покупателей

5.0
Отзывы: 2
5
100 %
4
0 %
3
0 %
2
0 %
1
0 %
Отзывы покупателей
October 20, 2026
Range Pressure Map provided a clean and consistent range view on EURUSD and XAUUSD across H1 and M1. High, Mid and Low levels were clearly plotted, while the displayed range percentage matched the visible price location well. The pressure proxy added context without cluttering the chart or being presented as true order flow. Score 4,7/5
October 7, 2026
A range high, midpoint and low put the pressure proxy in a clear setting. Lookback and EMA controls make the view adjustable, and the description is upfront about using tick volume rather than real buyer and seller flow. That honesty makes the map easier to interpret.

Частые вопросы

EMA
Volume
Продукты, доступные в cTrader Store, включая торговых ботов, индикаторы и плагины, предоставляются сторонними разработчиками и доступны исключительно в информационных и технических целях. cTrader Store не является брокером и не предоставляет инвестиционные консультации, персональные рекомендации или какие-либо гарантии будущей доходности.

Больше от этого автора

Логотип продукта "BOS CHOCH Structure"
Высокий рейтинг
4.5
(4)
$29
/
$39
Индикатор
BOS
MSS
+4
See confirmed BOS, CHOCH and SWEEP structure events on your cTrader chart.
Индикатор
BOS
Add standard-timeframe context candles to a native Renko chart.
Индикатор
Channel
Key Levels
+1
Monitor a selected chart trendline and confirm breaks on candle close.
Десктопный плагин
Trade Journal
Trade Statistics
Review daily PnL, trade counts, losing streaks and rapid re-entry from your cTrader history.
Десктопный плагин
Chart UI Tools
Keep lines, zones and channels synced across selected same-symbol charts from one desktop plugin.
сиБот
Drawdown Guard
Daily Loss Limit
Monitor account-wide loss and stop-loss risk budgets, with optional order cancellation and post-fill closure.
Десктопный плагин
Position Sizer
Risk Calculator
Size manual trades from your risk settings and review Market, Limit or Stop orders before execution.
Индикатор
Volume
Key Levels
View tick activity across a selected chart range with Point of Control, Value Area High and Value Area Low.

Вам также может понравиться

Индикатор
Forex
Crypto
+5
The best filter for trading trend continuations on Renko charts.
Логотип продукта "Sniper Ashfield Pro"
Высокий рейтинг
4.4
(5)
$29
/
$47
Индикатор
ADX
ATR
+5
EMA-cross signals scored on six confluence layers, with an ATR stop, three targets and a live panel
Индикатор
ATR
Volume
+2
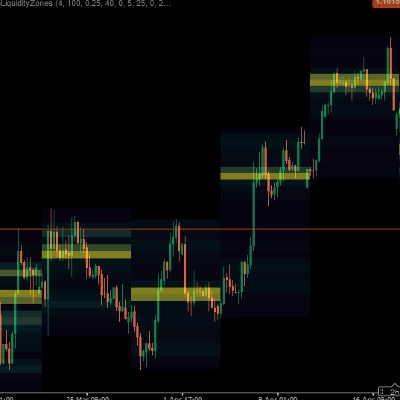
Heatmap Liquidity Zones Visualize volume-at-price, uncover hidden support/resistance, and track market liquidity in real
Индикатор
Volume
Key Levels
+1
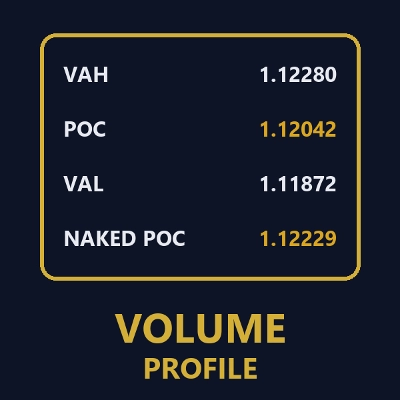
Session volume profiles from tick volume: POC, value area high and low, and naked POCs extended until touched.
Логотип продукта "Market Regime_Detector"
Высокий рейтинг
4.6
(5)
$23
Индикатор
ADX
ATR
+5
Identifies TRENDING, RANGING and VOLATILE markets with pullback detection. Anti-noise filter. Works on ANY chart.
Логотип продукта "Multi VWAP"
Новинка
4.6
(3)
от $9
Индикатор
VWAP
Volume
+5
Multi VWAP. Three timeframes. One clean chart. Your Essential Trading Tool.
Индикатор
Drawdown Monitor
Protect your funded account. Real-time Daily Equity Drawdown monitor with Green / Orange / Red flashing alerts.
Индикатор
Prop
Forex
+5
Color Volume Bars – Visualize Market Strength Instantly
Индикатор
Forex
Indices
+1
Professional Fair Value Gaps with multitimeframe spot on
Индикатор
VWAP
Volume
+4
Advanced Order Flow & Volume Profiling for cTrader. Unveil institutional footprints, Delta, and Anchored VWAPs.
Индикатор
RSI
BTCUSD
+5
Traders Dynamic Index (TDI) — Divergence Edition
Индикатор
ATR
Channel
Reversal Trap Probability Bands plots a dynamic volatility envelope around price & automatically detects "trap" reversal
Индикатор
EMA
RSI
+4
🚀📈 Plot buy/sell signals on Range Bars using Moving Averages and RSI. Clear, actionable trading insights.🚀📈
Индикатор
Volume
Key Levels
Dynamic Visible Range Volume Profile for cTrader. Real-time POC, Value Area & Smart Alerts for precise trading.
Индикатор
XAUUSD
Professional Volume Profile Indicator - Shows volume distribution, POC, Value Areas & Buy/Sell pressure.
Логотип продукта "ZigXRay"
Высокий рейтинг
4.6
(5)
$29
/
$49
Индикатор
CHOCH
Key Levels
+5
ZigZag Market Structure Identifier - Multi-Layer Scanner: Convergent Pivot Detection, 4-TF Overlay & Naked Chart Mode.
Индикатор
RSI
VWAP
+5
Trend direction, chart signals, reversal zones and volume tools in one configurable indicator.
Индикатор
ATR
Key Levels
+1
Explore 88 harmonic price-pattern variants with interactive chart controls and geometric reference levels.

Цена

С 16/09/2026