Descripción
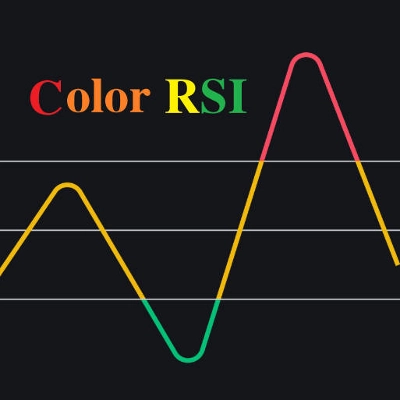
Este es un super indicador que integra el indicador RSI con un sistema de medias móviles dual. La intensidad del RSI se representa con cuatro colores: rojo (>70) > naranja (>50) > amarillo (>30) > verde. Las medias móviles duales usan EMA con parámetros predeterminados establecidos en 48/144, que pueden personalizarse según sus necesidades.
Cómo usar:
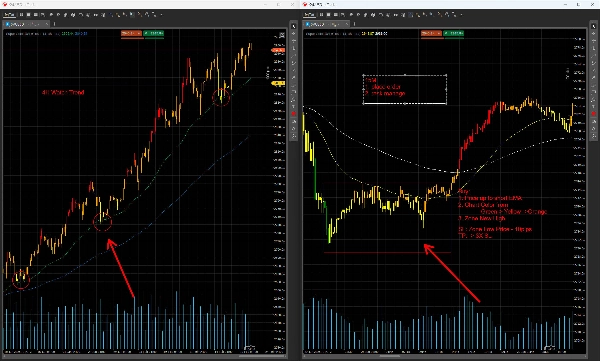
Cuando se usa junto con múltiples marcos temporales (por ejemplo, 4H→15M; 1H→5M, ilustrado aquí usando 4H→15M como ejemplo):
- Identificación de tendencia mediante EMAs duales (marco temporal 4H):
-
- Tendencia alcista: 48EMA por encima de 144EMA.
- Tendencia bajista: 48EMA por debajo de 144EMA.
- Consolidación en rango: Las dos EMAs están entrelazadas.
- Puntos de entrada/salida en el marco temporal 15M:
-
- Configuración de compra (tendencia alcista):
-
- El precio retrocede hacia la 48EMA en el gráfico 4H.
- Cambiar a 15M: Entrar cuando el precio rompa por encima de el rango de consolidación de 15M.
- Stop loss: Establecer en el máximo reciente +10 pips .
- Configuración de venta (tendencia bajista):
-
- El precio retrocede hacia la 48EMA en el gráfico 4H.
- Cambiar a 15M: Entrar cuando el precio rompa por debajo de el rango de consolidación de 15M.
- Stop loss: Establecer en el mínimo reciente –10 pips .
- Señales de divergencia de precio:
-
- Divergencia bajista (máximo):
-
- El precio alcanza un nuevo máximo (en retroceso), pero el color del RSI cambia de rojo (RSI >70) a naranja (RSI >50) .
- Divergencia alcista (mínimo):
-
- El precio alcanza un nuevo mínimo (en retroceso), pero el color del RSI cambia de verde (RSI ≤30) a amarillo (RSI ≤50) .
Advertencia de riesgo:
Ningún indicador se adapta a todas las condiciones del mercado. Pruebe esta estrategia a fondo en un entorno de demostración antes de aplicarla en trading en vivo. El uso incorrecto puede llevar a pérdidas significativas.
Resumen
Perfil del indicador
Valoraciones de clientes
0.0
Valoraciones: 0
Valoraciones de clientes
Este producto todavía no se ha valorado. ¿Ya lo ha probado? Sea el primero en informar a otros.
Conversación
Preguntas frecuentes
Prop
Forex
Indices
Commodities
RSI
Crypto
Stocks
Los productos disponibles a través de cTrader Store, incluidos bots, indicadores y plugins para operar, son proporcionados por desarrolladores de terceros y están disponibles únicamente con fines informativos y de acceso técnico. cTrader Store no es un bróker, por lo que no proporciona asesoramiento de inversión, recomendaciones personales ni ninguna garantía de rentabilidad futura.


Precio
Desde 30/09/2024
44
Ventas