
Описание
Принцип работы индикатора UTBot (итальянский)
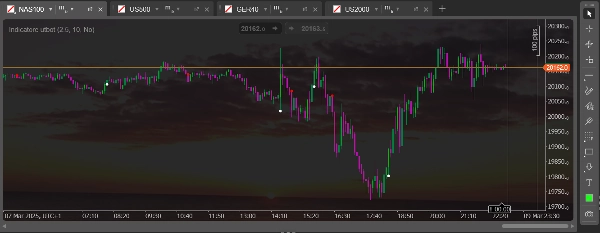
Индикатор UTBot — это инструмент технического анализа, который создает динамическую линию трейлинг-стопа на основе ATR. Он вычисляет значение стопа, используя ATR, умноженный на коэффициент чувствительности, создавая таким образом поддержку/сопротивление, адаптирующееся к волатильности. Определяет восходящие тренды, когда цена находится выше этой линии, и нисходящие, когда ниже. Генерирует сигналы на покупку, когда цена пересекает линию снизу вверх, и сигналы на продажу, когда пересекает сверху вниз. Пересечение EMA с линией трейлинг-стопа часто используется как подтверждение. Эффективен на направленных рынках и для управления динамическими стопами по открытым позициям.
UTBot Indicator Functionality (English)
The UTBot indicator is a technical analysis tool that creates a dynamic trailing stop line based on ATR. It calculates a stop value using ATR multiplied by a sensitivity factor, creating support/resistance that adapts to volatility. It identifies uptrends when price stays above this line and downtrends when below. It generates buy signals when price crosses above the line from below and sell signals when crossing below from above. An EMA crossover with the trailing stop line is often used as confirmation. It's effective in directional markets and for managing dynamic stops for open positions.
Сводка
Отзывы покупателей
5 | 100 % | |
4 | 0 % | |
3 | 0 % | |
2 | 0 % | |
1 | 0 % |


